Technical Analysis is the study of stock price movement, charts, volume, and market trends to predict future price direction. Instead of focusing on company financials, technical analysts mainly study chart patterns and market behavior.
The main belief behind technical analysis is that all market information is already reflected in the stock price, and price movements often repeat because market psychology repeats.
Technical Analysis is widely used by intraday traders, swing traders, scalpers, and options traders to identify trading opportunities and manage risk effectively.
Key Concepts of Technical Analysis
1. Trend Analysis
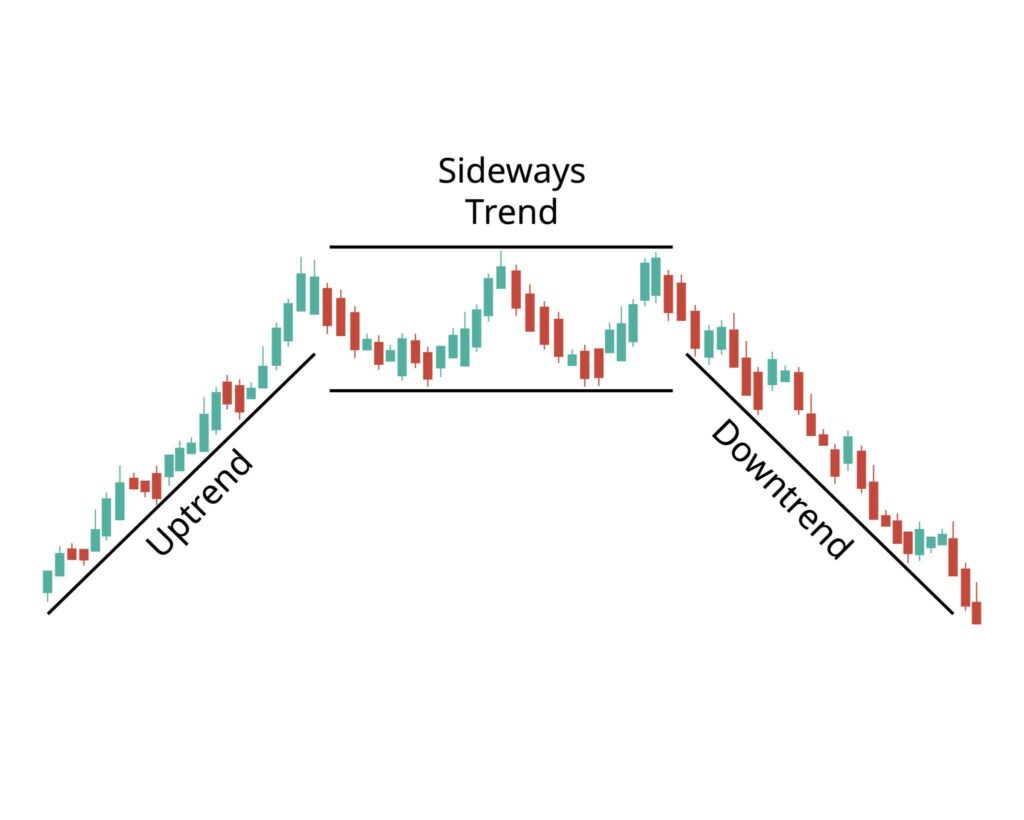
Markets generally move in trends:
- Uptrend → Higher highs & higher lows
- Downtrend → Lower highs & lower lows
- Sideways Trend → Market moves in a range
Identifying the trend helps traders trade in the right direction.
2. Support & Resistance
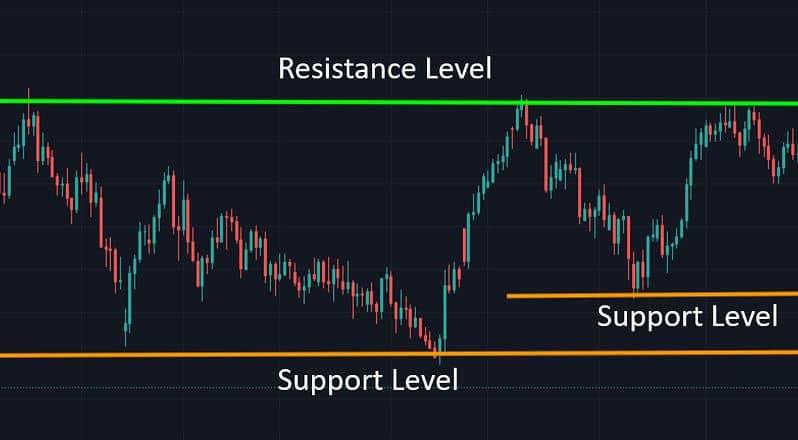
Support
A price level where buying pressure increases and price may stop falling.
Resistance
A price level where selling pressure increases and price may stop rising.
These levels help traders find entry and exit points.
3. Candlestick Patterns
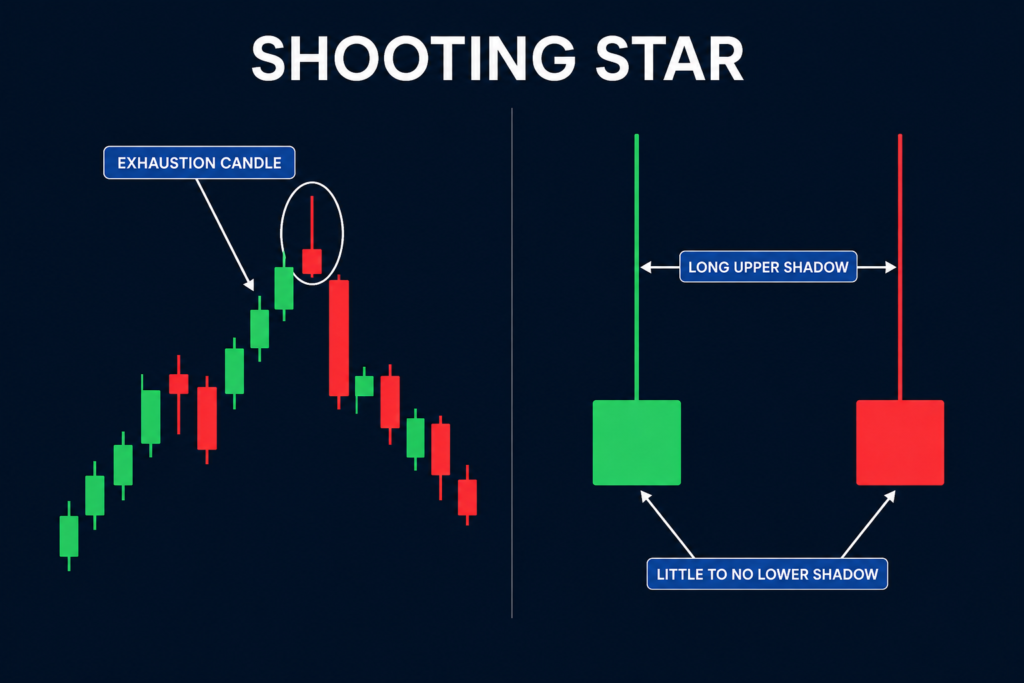
Candlesticks show market psychology and price behavior.
Popular patterns include:
- Doji
- Hammer
- Shooting Star
- Engulfing Pattern
These patterns help traders identify possible reversals or trend continuation.
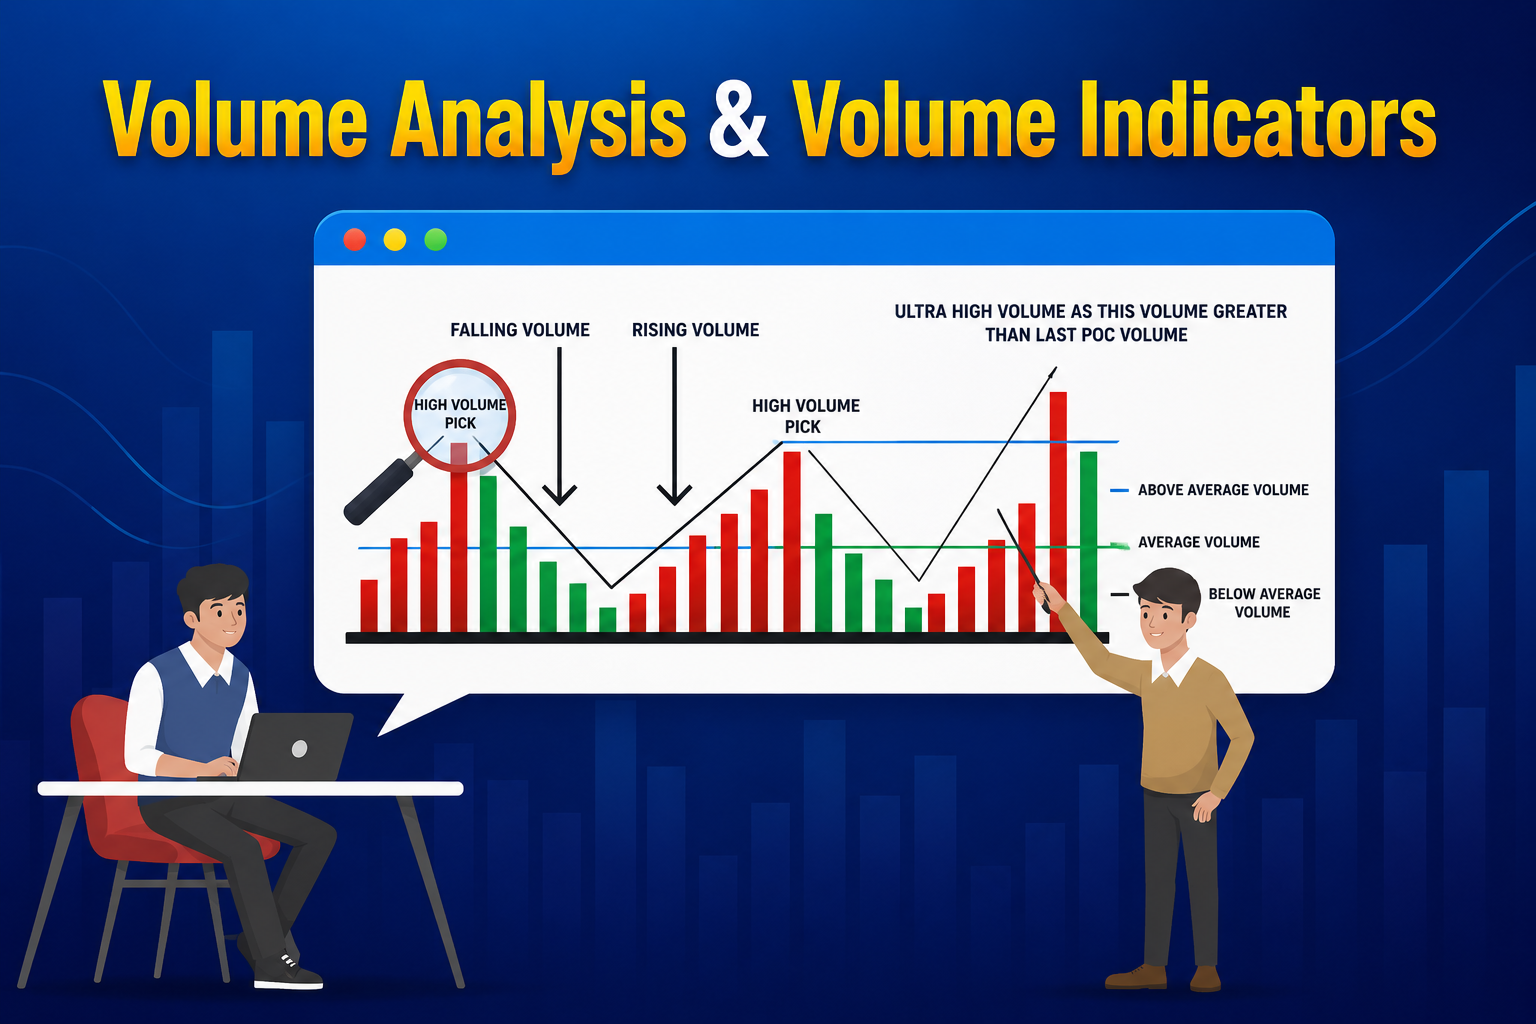
4. Volume Analysis
Volume shows how many shares are traded.
- High volume = Strong movement
- Low volume = Weak movement
Volume is important for confirming breakouts and trend strength.
5. Indicators in Technical Analysis
RSI (Relative Strength Index)
Used to identify overbought and oversold conditions.
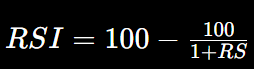
- RSI above 70 = Overbought
- RSI below 30 = Oversold
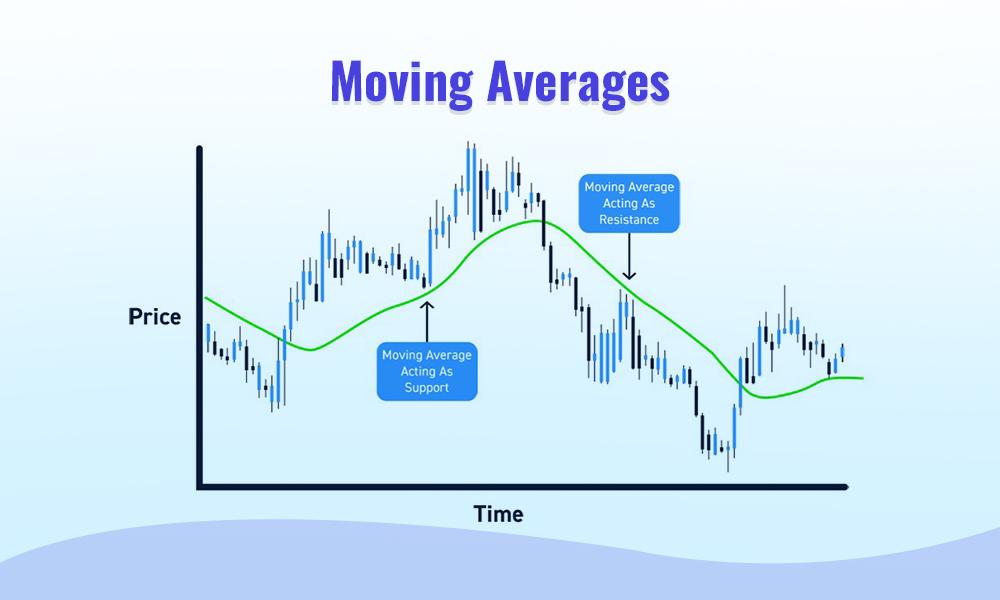
Moving Average
Helps identify trend direction and dynamic support/resistance.
MACD
Used to measure momentum and trend reversals.
Benefits of Technical Analysis
Helps identify trends
Improves entry and exit timing
Useful for short-term trading
Helps manage risk
Easy to analyze visually through charts
Limitations of Technical Analysis
No strategy is 100% accurate
False breakouts can occur
Indicators may lag
Sudden news can affect price movement
Conclusion
Technical Analysis is one of the most popular methods used in the stock market to study price action and market trends. It helps traders make better trading decisions using charts, indicators, volume, and patterns.
However, successful trading does not depend only on indicators. Proper risk management, discipline, and patience are equally important for long-term success in the market.