Volume Analysis is the study of trading volume to understand the strength, momentum, and reliability of a price movement in the stock market.
In simple words, volume shows how many shares or contracts are traded during a specific period of time. It helps traders understand whether buyers or sellers are dominating the market.
Volume is considered one of the most important tools in technical analysis because price movement without strong volume is often considered weak or unreliable.
It is widely used by:
- Intraday traders
- Swing traders
- Price action traders
- Institutional traders
- Options traders
What is Volume in the Stock Market?
Volume represents the total number of shares traded in a stock during a given timeframe.
Example:
If 10 lakh shares of a company are traded in one day, the daily volume is 10 lakh.
Higher volume usually means:
- Strong market participation
- High interest in the stock
- Strong momentum
Lower volume usually means:
- Weak participation
- Lack of interest
- Uncertain movement
Why Volume Analysis is Important
Volume helps traders:
- Confirm trends
- Identify strong breakouts
- Detect reversals
- Understand buyer and seller strength
- Avoid fake moves
Professional traders often say:
“Volume confirms price.”
Types of Volume Behavior
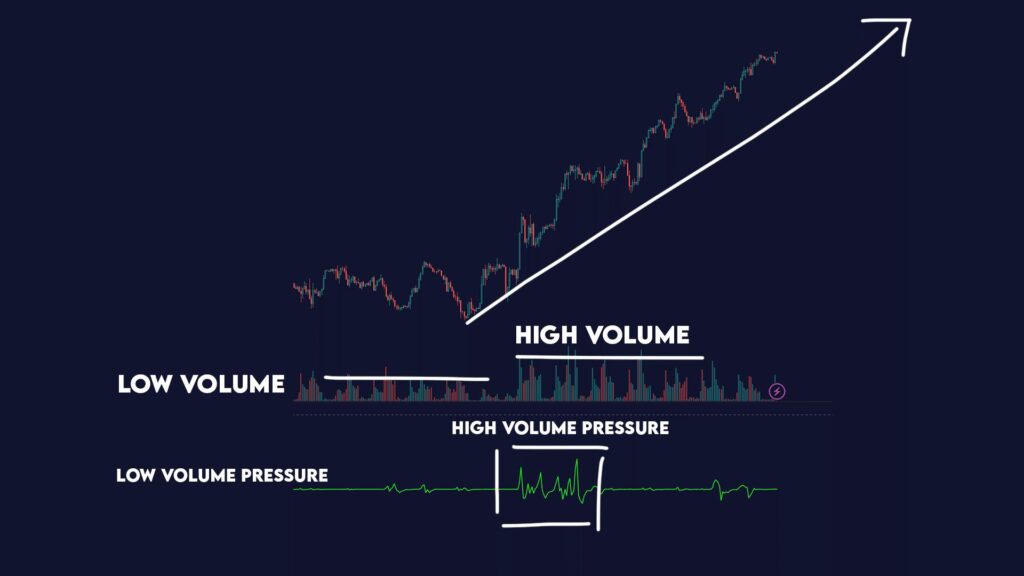
1. High Volume
High volume indicates strong market activity.
Meaning:
- Strong buying or selling pressure
- Institutional participation
- Strong momentum
📈 If price rises with high volume → Bullish signal
📉 If price falls with high volume → Bearish signal
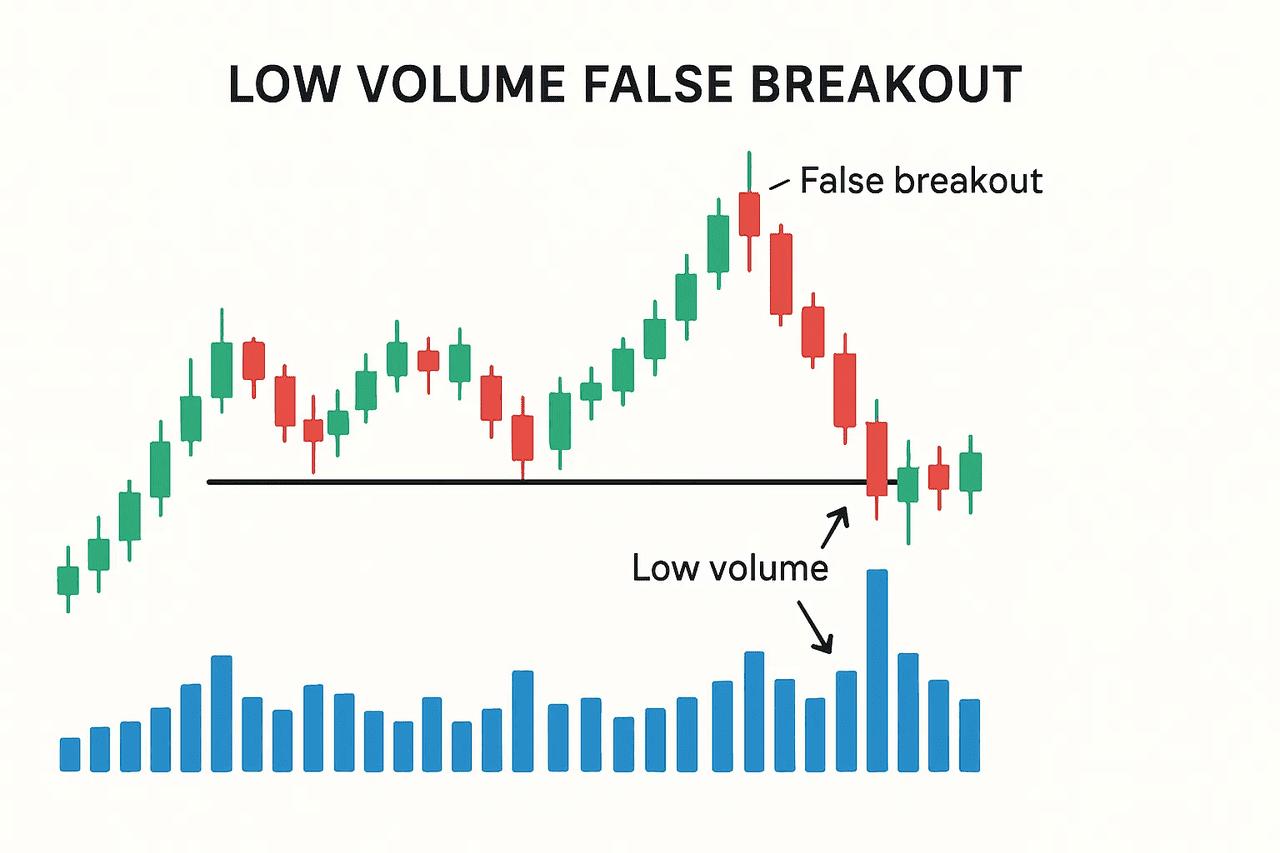
2. Low Volume
Low volume indicates weak market participation.
Meaning:
- Weak trend
- Lack of conviction
- Possible fake breakout
Low-volume movements are generally considered less reliable.
Volume and Price Relationship
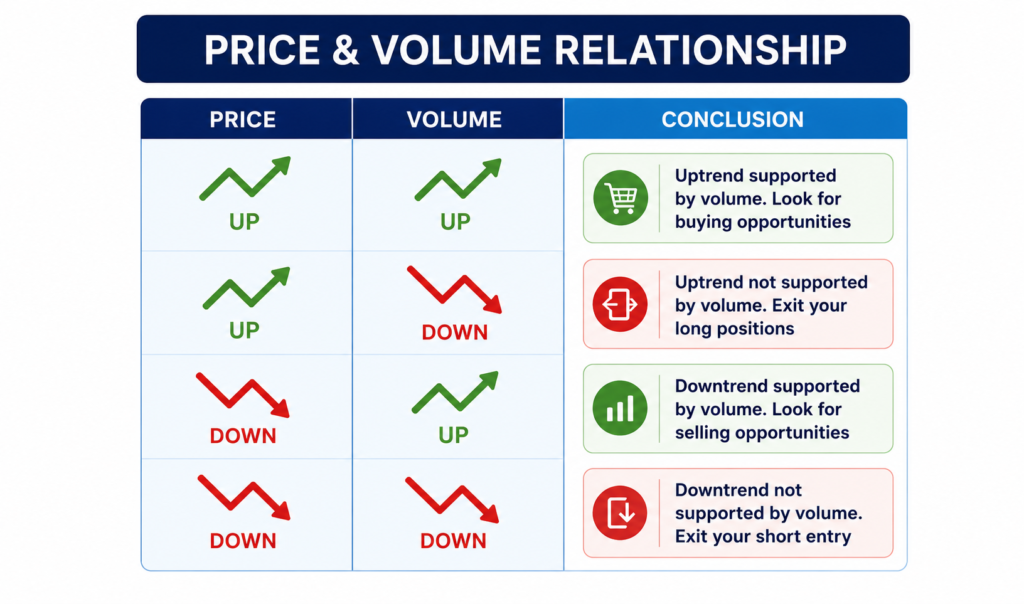
Price Up + Volume Up
Strong bullish signal.
Shows buyers are actively participating.
Price Down + Volume Up
Strong bearish signal.
Indicates aggressive selling pressure.
Price Up + Volume Down
Weak bullish movement.
Trend may not sustain.
Price Down + Volume Down
Selling pressure is weakening.
Possible reversal or consolidation.
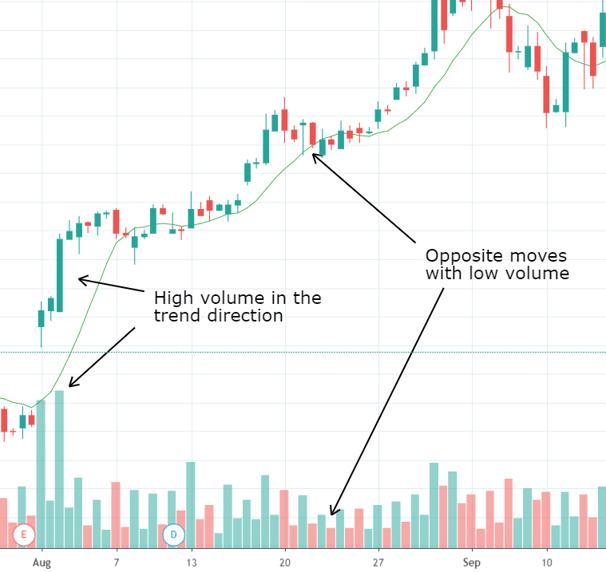
Volume Breakout Analysis
Breakouts become more reliable when supported by strong volume.
Strong Breakout
- Price crosses resistance
- Volume increases sharply
This indicates strong buyer participation.
Weak Breakout
- Price crosses resistance
- Volume remains low
This may result in a fake breakout.
Volume Indicators

1. Volume Bars
Basic volume shown below charts.
Green bars usually indicate buying strength, while red bars show selling activity.
2. On-Balance Volume (OBV)
OBV combines price and volume to measure buying and selling pressure.
3. Volume Weighted Average Price (VWAP)
VWAP shows the average trading price based on volume.
VWAP=∑Volume∑(Price×Volume)
Widely used by intraday traders and institutions.
Importance of Volume in Different Trading Styles
Intraday Trading
Used for:
- Breakout confirmation
- Momentum trading
- Scalping setups
Swing Trading
Helps identify:
- Strong trend continuation
- Reversal confirmation
Price Action Trading
Volume improves the reliability of candlestick patterns and market structure.
Advantages of Volume Analysis
Confirms trend strength
Detects strong breakouts
Helps identify institutional activity
Improves trading accuracy
Works well with price action
Limitations of Volume Analysis
Volume alone cannot predict direction
Sudden news can distort volume
Fake volume spikes may occur
Requires confirmation from price action
Conclusion
Volume Analysis is a powerful tool that helps traders understand the strength behind price movement. It confirms trends, improves breakout accuracy, and reveals buyer-seller activity in the market.
Successful traders often combine:
- Volume Analysis
- Price Action
- Technical Indicators
- Risk Management
to make more accurate and confident trading decisions in the stock market.