Multi-Timeframe Analysis is a trading method where traders analyze the same stock or market across multiple timeframes to understand the bigger trend and find more accurate entry and exit points.
Instead of depending on only one chart timeframe, traders combine higher and lower timeframes together for better market confirmation and risk management.
This approach is widely used by:
- Intraday traders
- Swing traders
- Price action traders
- Forex traders
- Options traders
Multi-Timeframe Analysis helps traders avoid trading against the main trend and improves overall trade accuracy.
What is Multi-Timeframe Analysis?
Multi-Timeframe Analysis means studying the market on different chart timeframes simultaneously.
Example:
- Daily Chart → Main trend
- 1-Hour Chart → Trade setup
- 15-Minute Chart → Entry timing
This gives traders a complete view of the market structure.
Why Multi-Timeframe Analysis is Important
Using only one timeframe can sometimes give incomplete or misleading signals.
A trade may look bullish on a 5-minute chart but bearish on the daily chart.
Multi-Timeframe Analysis helps traders:
- Trade with the main trend
- Improve entry timing
- Avoid false signals
- Increase trade confidence
- Manage risk better
Common Timeframe Combinations
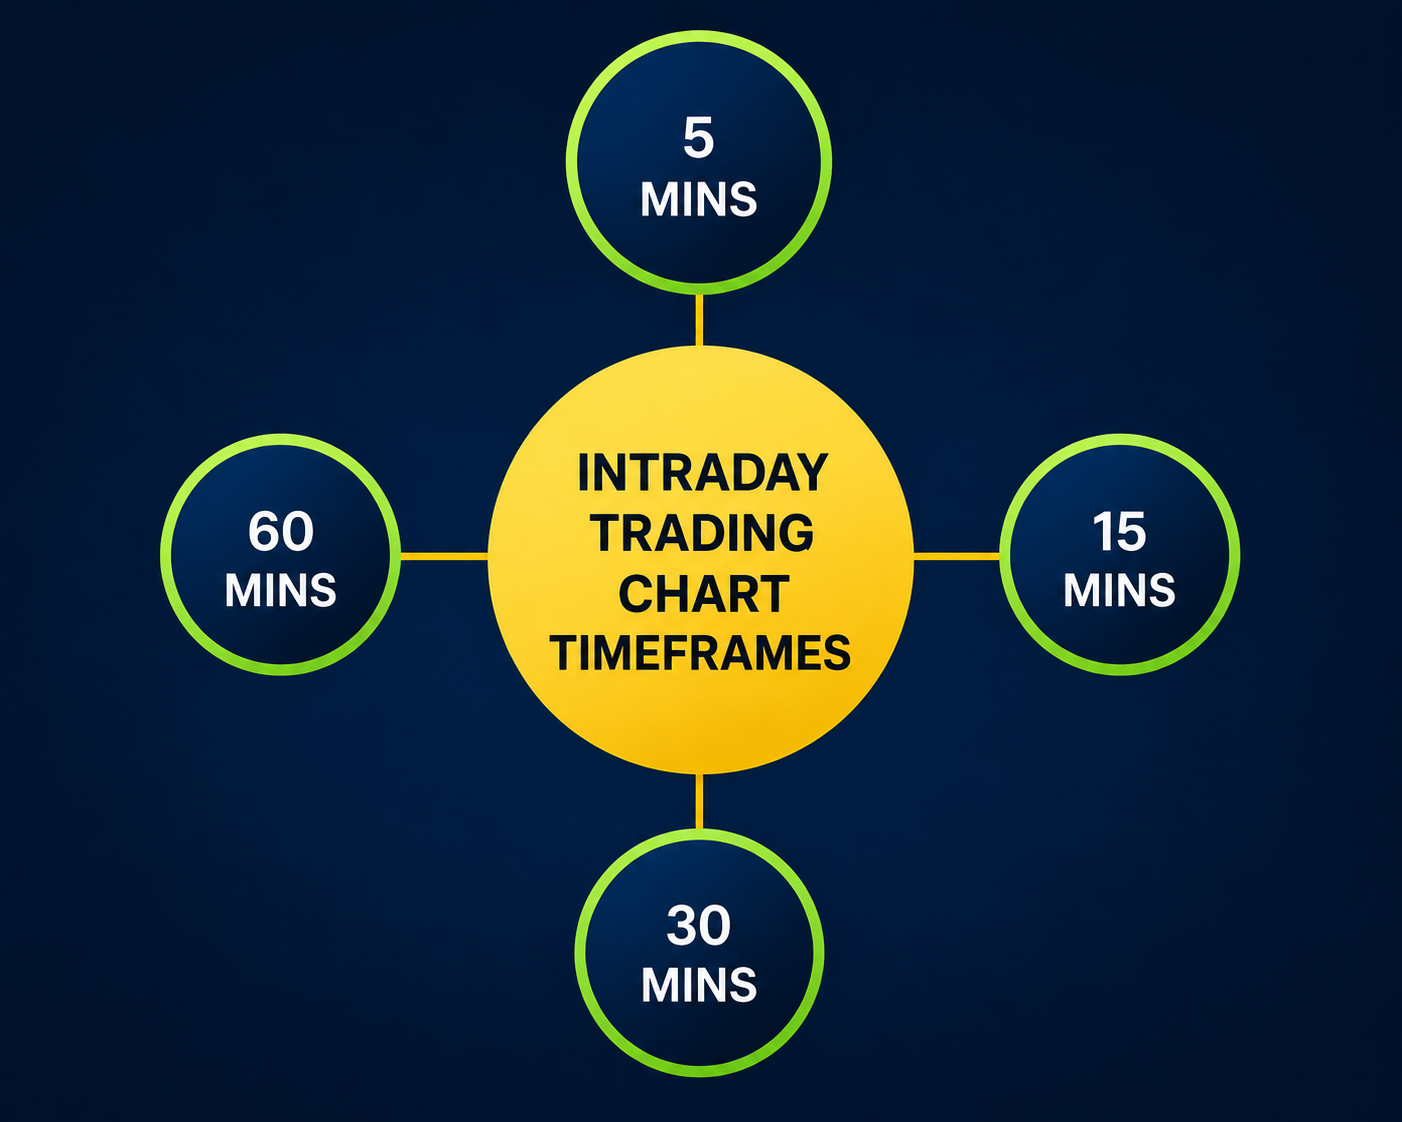
Intraday Trading
- 1-Hour Chart → Main trend
- 15-Minute Chart → Setup
- 5-Minute Chart → Entry
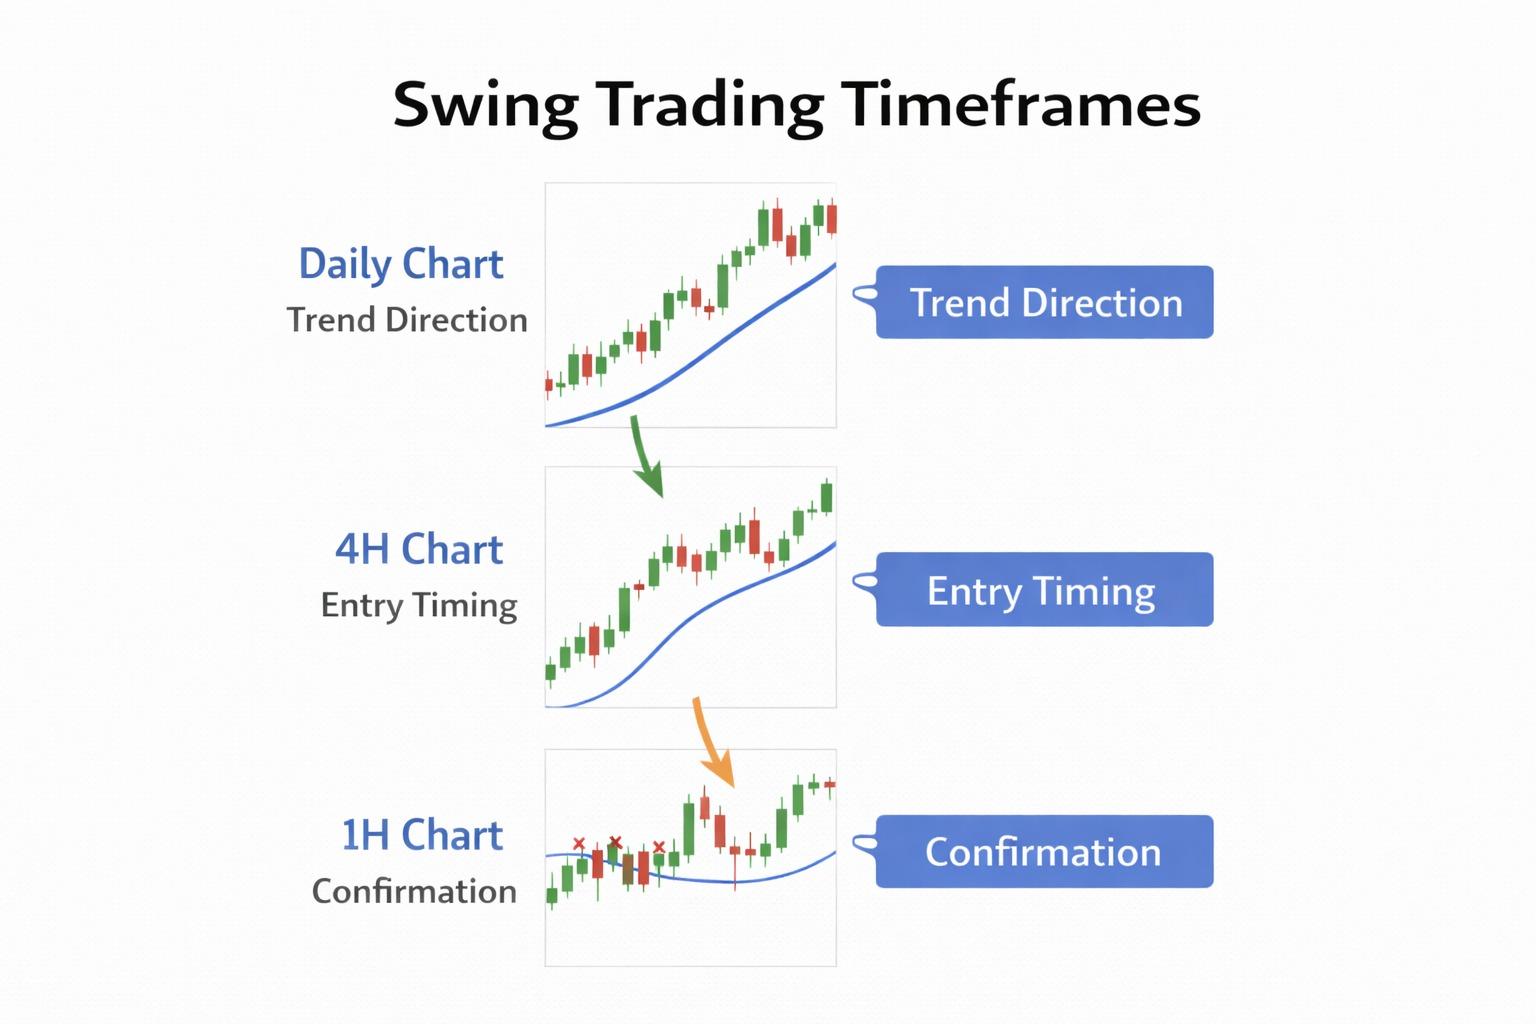
Swing Trading
- Daily Chart → Main trend
- 4-Hour Chart → Setup
- 1-Hour Chart → Entry
Positional Trading
- Weekly Chart → Long-term trend
- Daily Chart → Setup
- 4-Hour Chart → Entry
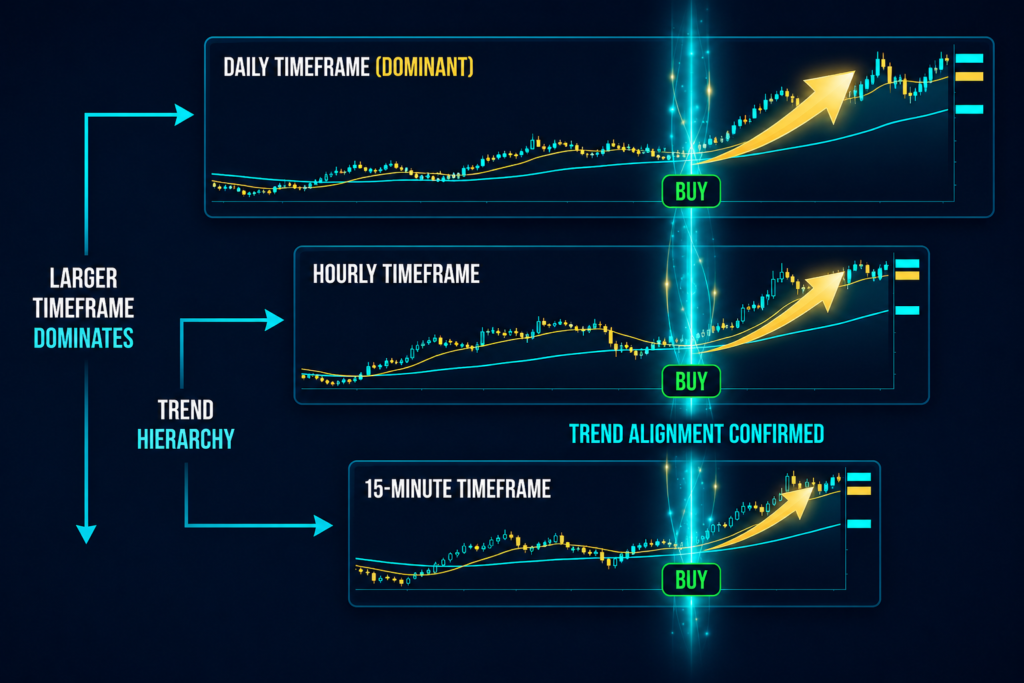
How Multi-Timeframe Analysis Works
1. Identify the Main Trend
Start with the higher timeframe to understand overall market direction.
Example:
If the daily chart is bullish, traders prefer buying opportunities.
2. Find Trade Setup
Move to the medium timeframe to identify:
- Support & resistance
- Breakouts
- Chart patterns
- Price action setups
3. Take Entry on Lower Timeframe
Use the lower timeframe for:
- Accurate entry
- Stop-loss placement
- Risk management
This helps reduce risk and improve reward potential.
Benefits of Multi-Timeframe Analysis
Improves trade accuracy
Helps trade with the trend
Better entry and exit timing
Reduces false signals
Useful in all markets
Limitations of Multi-Timeframe Analysis
Can confuse beginners
Too many timeframes may create conflicting signals
Requires patience and practice
Over-analysis may delay decisions
Important Tips for Multi-Timeframe Analysis
- Always start from higher timeframe
- Trade in the direction of the main trend
- Avoid using too many timeframes
- Combine with price action and volume
- Maintain proper risk management
Professional traders usually focus more on trend alignment than random entries.
Conclusion
Multi-Timeframe Analysis is one of the most effective methods for understanding market structure and improving trading decisions. By combining higher and lower timeframes, traders can align with the main trend, improve entry timing, and reduce trading mistakes.
When used with technical analysis, price action, and proper risk management, Multi-Timeframe Analysis becomes a highly powerful tool for successful trading in the stock market.