In the previous article, we discussed how important direction and time frame selection are before using Saarathi. We also covered the indicator overview and understood its components. Now, in this article, we will discuss in detail how to use Saarathi to create a proper trade plan — with step-by-step examples.
Our focus will be on practical application, so you can clearly understand how to make structured trading decisions using the indicator.
The POI (Point of Interest) identifies the key decision area, the Direction Line shows which side of the market is in control, and the Defence Line helps determine whether the POI is being respected or failing.

Market is like a game of kabaddi.
Just like in kabaddi, buyers and sellers try to control their own area. they try to control and defend their area. The side that successfully defends its territory wins the move.
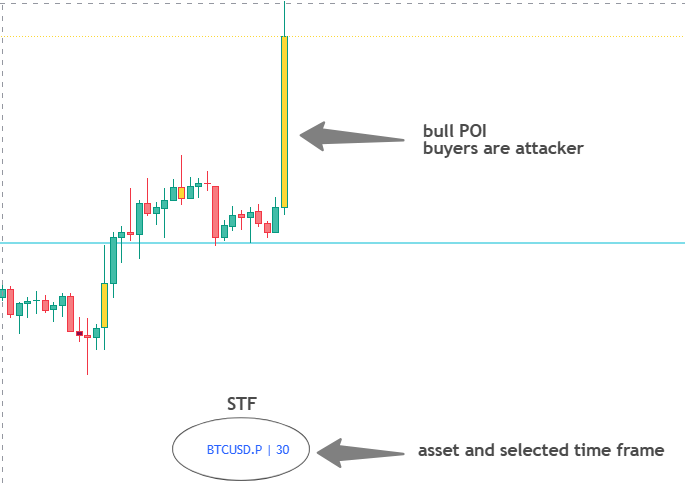
Now let’s understand this with POI. When a Bull POI forms, it means buyers are strong. Buyers become the attacker and they will try to control the game. The Defence Line helps us identify how far buyers are able to defend their position.
– If buyers successfully defend the Defence Line, the market moves upward.
– If buyers fail to defend it, sellers step in and take control.
The same logic applies to sellers as well.
When a Bear POI forms, it means sellers are strong.
Sellers become the attacker and try to defend their area.
– If sellers successfully defend the Defence Line, the market moves downward.
– If they fail, buyers gain strength and the market moves upward.
So for us, the important question becomes simple —
who is attacking, and how long can they control their area?
If the attacker successfully controls the area → it leads to continuation.
If the attacker fails to control it → the market flips.
Based on this simple logic, Saarathi has two main trading strategies:
POI Range Continuation
POI Range Flip
POI Range Continuation
(Timeframe selection has already been discussed earlier. If you haven’t read it, please refer to the previous articles.)
Step 1 – Select STF (Saarathi Time Frame)
-Choose the timeframe based on your trading style and comfort.
-Select the asset you want to trade and apply the appropriate timeframe.
Step 2 – Wait for POI Formation
-Wait for the POI bar on the selected timeframe to fully close.
-If the candle is yellow, it indicates a Bull POI.
-If the candle is maroon, it indicates a Bear POI.
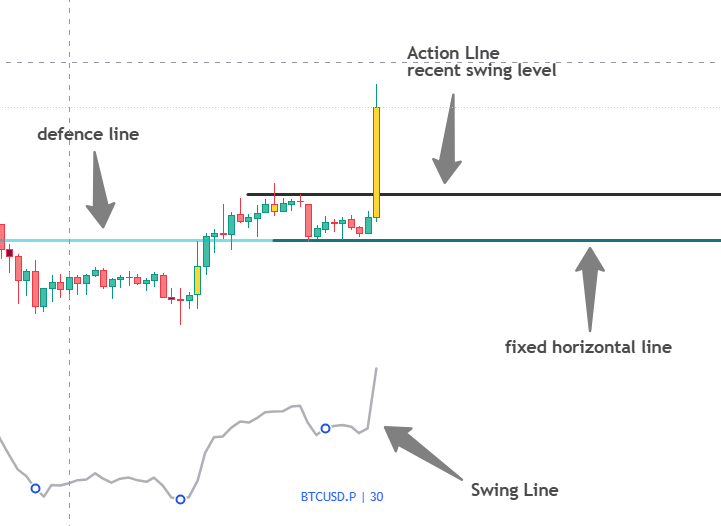
Step 3 – Identify the Defence Line
After the POI forms, the Defence Line will be plotted automatically.
Aqua line – Bull POI
Red line – Bear POI
Now, plot a horizontal line exactly at the POI Defence level.
(Since the Defence Line is dynamic, you must manually mark the exact Defence Line keep it fixed on your chart.)
This line represents the key control area.
Step 4 – Mark the Action Line
Mark the recent swing high or swing low.
This will act as your structural breakout level.
Bull POI – mark the recent swing high.
Bear POI – mark the recent swing low.
(If there is confusion in identifying the swing high, swing low, or structure, the Swing Line can be used for guidance)
In this case, a Bull POI has formed, and the POI has already broken the recent swing high.
We have also marked the buyers’ area.
This means the trading zone is already defined.
Saarathi has shown us the direction — now it is Rathi’s turn, which means it is time to take action.
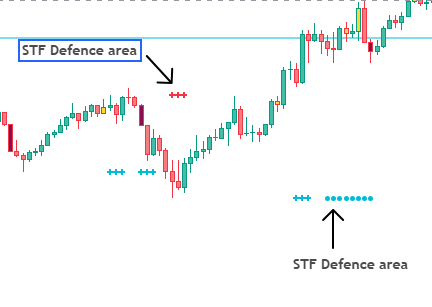
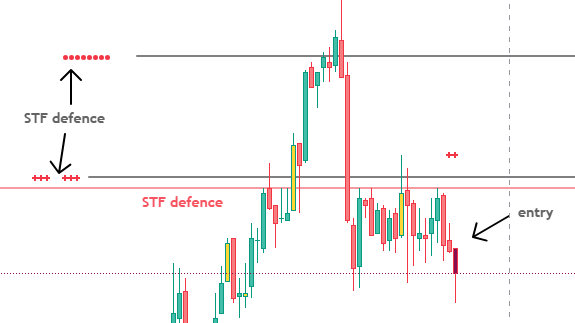
We have also provided STF interval options in the settings.
By enabling them, the STF (Saarathi Timeframe) defence area will automatically appear on the chart.
This allows you to view higher timeframe levels without repeatedly changing the chart timeframe.
You simply need to mark those signals with extended horizontal lines to use them effectively.
Step 5 – Select RTF (Rathi Time Frame)
Now that the levels and the buyers’ area are clearly defined, the next step is execution.To take an entry, shift to a lower timeframe.
The smaller timeframe will help in refining the entry within the defined buyers’ area. (If STF signals are enabled, you can directly mark the levels on the RTF (your entry timeframe) and execute your trades without needing to switch timeframes.)
Step 6 – Time to Take Action
Now focus on the RTF (Rathi Time Frame).
To plan a trade, observe the price action around the defence levels.
Buy Trade Setup
Now focus on the RTF (Rathi Time Frame).
To plan a trade, observe the price action around the defence levels.
If the price approaches a bullish defence area and shows an upside structure shift on the RTF (entry timeframe), or forms a clear bullish pattern such as a Bullish Engulfing or Morning Star, a buy trade opportunity may develop.
If the price fails to respect the bearish defence area and the structure shifts upward, it can also indicate a potential bullish trade setup.
Stop Loss:
Place the stop loss below the recent swing low.
Target & Trailing:
For the first target, use the Black Box level shown on the top right corner of the chart.
After the first target is achieved, the stop loss can be trailed using the low of the recent two candles to protect profits while allowing the trade to continue.
Sell Trade Setup
If the price approaches a bearish defence area and shows a downside structure shift on the RTF, or forms a clear bearish pattern, it may create a sell trade opportunity.
If the price fails to respect the bullish defence area and the market structure shifts downward, it can also indicate a potential bearish trade setup.
Stop Loss:
Place the stop loss above the recent swing high.
Target & Trailing:
Use the Black Box level on the chart as the first target.
After reaching the first target, trailing can be done using the high of the recent two candles to secure profits while letting the trade run.
Final Thoughts
By now, the logic behind this method should be clear. As long as price does not come below the marked area or Direction line on the STF , there is no reason to even think about selling on the RTF.
We have already discussed that once the trading area and direction are clear, execution becomes much easier. Saarathi does this job effectively — it defines the area and shows the direction.
From there, the only focus should be on following the rules and executing with discipline.
Pro Tip
In this example, we used the 30-minute timeframe as STF and the 5-minute timeframe as RTF.
Now here is an advanced approach:
If, during the trade, a new POI forms on the 5-minute timeframe, the 5-minute can be treated as the new STF.
Then entries can be refined further on the 1-minute timeframe.
This allows capturing even smaller moves using the same rules and structure.
However, this is optional.
Only apply this if you are comfortable with lower timeframes.
Otherwise, it is better to stick to the major timeframe setup.
POI Range Flip
POI Range Flip setups are more common on smaller timeframes and less frequent on higher timeframes.
On major timeframes, once a flip happens, a new opposite POI is usually formed. In that case, we simply follow the rules of the new POI.
The entry criteria for POI Range Flip is almost the same as POI Range Continuation.
The only difference is that after the Defence Line is broken, we plan the trade in the opposite direction — with confirmation from the Direction Line.
Flip scenarios can also be avoided if preferred, as they mostly appear in choppy market conditions.
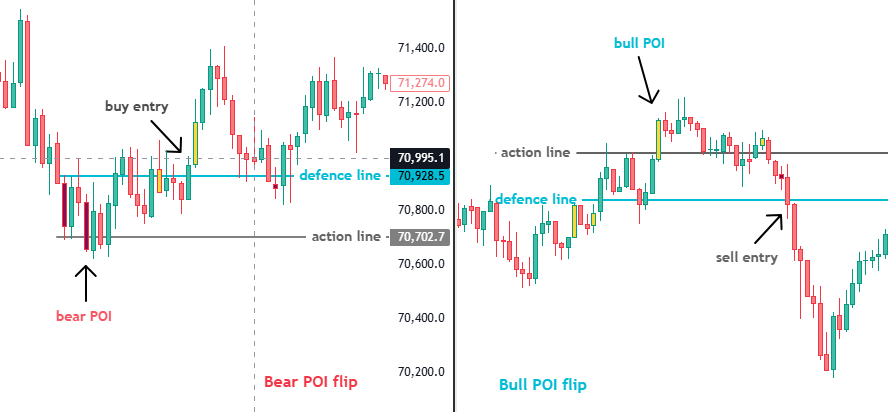
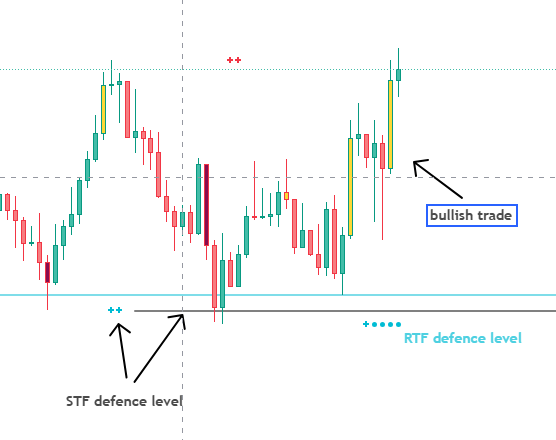
POI Range Flip – Example Explanation
In this example: In the left image, the example shows a Bear POI Range Flip trade, while the right image shows a Bull POI Range Flip trade.
In the Bear POI Flip case, a bearish POI forms first, and the action line and defence line are marked. However, instead of respecting the bearish POI, the market breaks the defence line with bullish strength. This indicates that the bearish side is losing control and buyers are gaining dominance. In such a situation, the trade plan shifts to the opposite direction, which in this case becomes a bullish trade opportunity.
The same concept applies to the Bull POI Flip. After a bullish POI forms, if the market breaks the bull defence line, it suggests that buyers are losing strength and sellers are starting to dominate. In that situation, a bearish entry opportunity can be considered.
A POI Flip generally represents a trend reversal phase, where the strength of one side weakens and the opposite side begins to take control of the market.
In most cases, after a POI Flip, the POI continuation rules still apply. This is because a new POI structure will form, and the trade should again be planned by marking the defence line and action line for the new setup.
Simple Summary
To keep it simple:
After a POI forms, mark the area.
If the area and Direction Line align in the same direction — go ahead.
If not, wait for the proper flip or confirmation scenario.
These situations will keep forming again and again.
Use the alert feature on higher timeframes.
Set an alert when a POI forms — only then plan the trade. Otherwise, focus on other work.
This multi-timeframe approach is designed to increase accuracy and improve clarity.
The time between alert and execution may feel long, but a trader should focus only on rule-based execution.
On this platform, you will continue to receive Saarathi examples, YouTube videos, and market updates.
Stay connected. If you find the information useful, please share it.
If you want to try this indicator, there is an access form available.
Fill it and submit — you can try it for a nominal amount.
Thank you.
Jai Shree Krishna 🙏