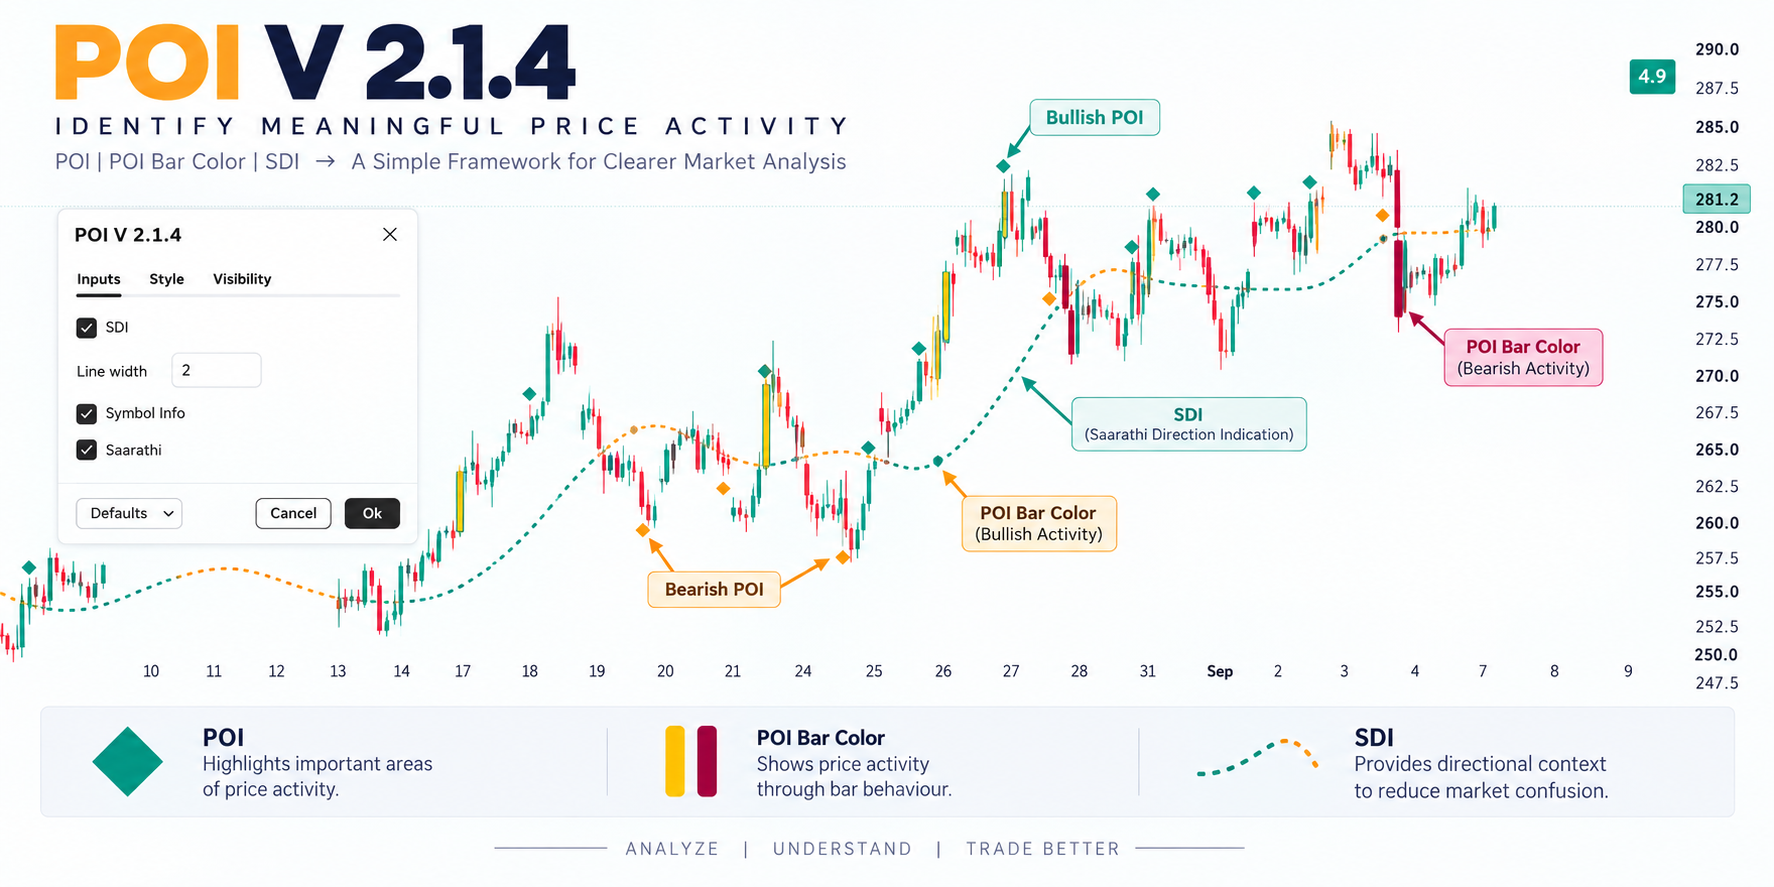
Markets continuously generate price activity, but not every movement carries the same significance. POI (Point of Interest) is a market-analysis framework designed to highlight important price activity and help understand the direction in which that activity is developing.
POI is the second indicator in the Saarathi Ecosystem and shares some similarities with our first indicator, Saarathi Momentum Shift Indicator (SMSI). However, POI has been developed with a stronger focus on price action and price behaviour, making it a more advanced and focused approach to reading the market.
While the two indicators have different approaches, SDI (Saarathi Direction Indication) remains a common component in both, helping identify the broader directional bias.
POI is an analysis framework, not an entry or exit system.
Understanding POI
Markets are driven by two sides — buyers and sellers. At every moment, both sides are trying to transact at prices they consider acceptable. The interaction between these two sides is what creates price movement.
To understand POI, let us first understand how this interaction can move price.
Imagine a buyer is willing to buy at 20, and a seller is also willing to sell at 20. If the transaction takes place at 20, there is no reason for price to move simply because the transaction happened — both sides agreed at the same level.
Now imagine buyers are strongly willing to buy, but sellers are no longer willing to sell at 20. The seller may now offer at 25, and if buyers are willing to accept that higher price, transactions begin taking place at 25. Price has effectively moved from 20 to 25.

This simple example represents the continuous interaction between buyers and sellers — one side accepting higher prices and the other side accepting lower prices. As this interaction develops, price leaves a trace of where meaningful activity and imbalance between the two sides has occurred.This is where the idea of a Point of Interest (POI) comes in.
A POI can be thought of as a battle ground between buyers and sellers — a point or area where meaningful price activity has taken place and one side has shown greater strength.
The purpose of POI is not to predict who will win the next battle. Instead, it helps bring attention to where the battle has already shown meaningful activity and which side was stronger at that point.
In simple terms:
POI → Where the important activity happened
Direction → Which side showed strength
This gives the trader a more structured way to observe price behaviour rather than looking at every price movement with equal importance.
(This is a simplified example to explain price movement; actual market price movement depends on the interaction between available buyers, sellers, and liquidity at different price levels.)
Understanding the Components of POI
POI is built around three simple visual components. Each component provides a different piece of information about price activity and directional context.
1. POI — Point of Interest
POI highlights important points of price activity where one side of the market has shown greater strength.
Teal Diamond → Bullish POI
Orange Diamond → Bearish POI
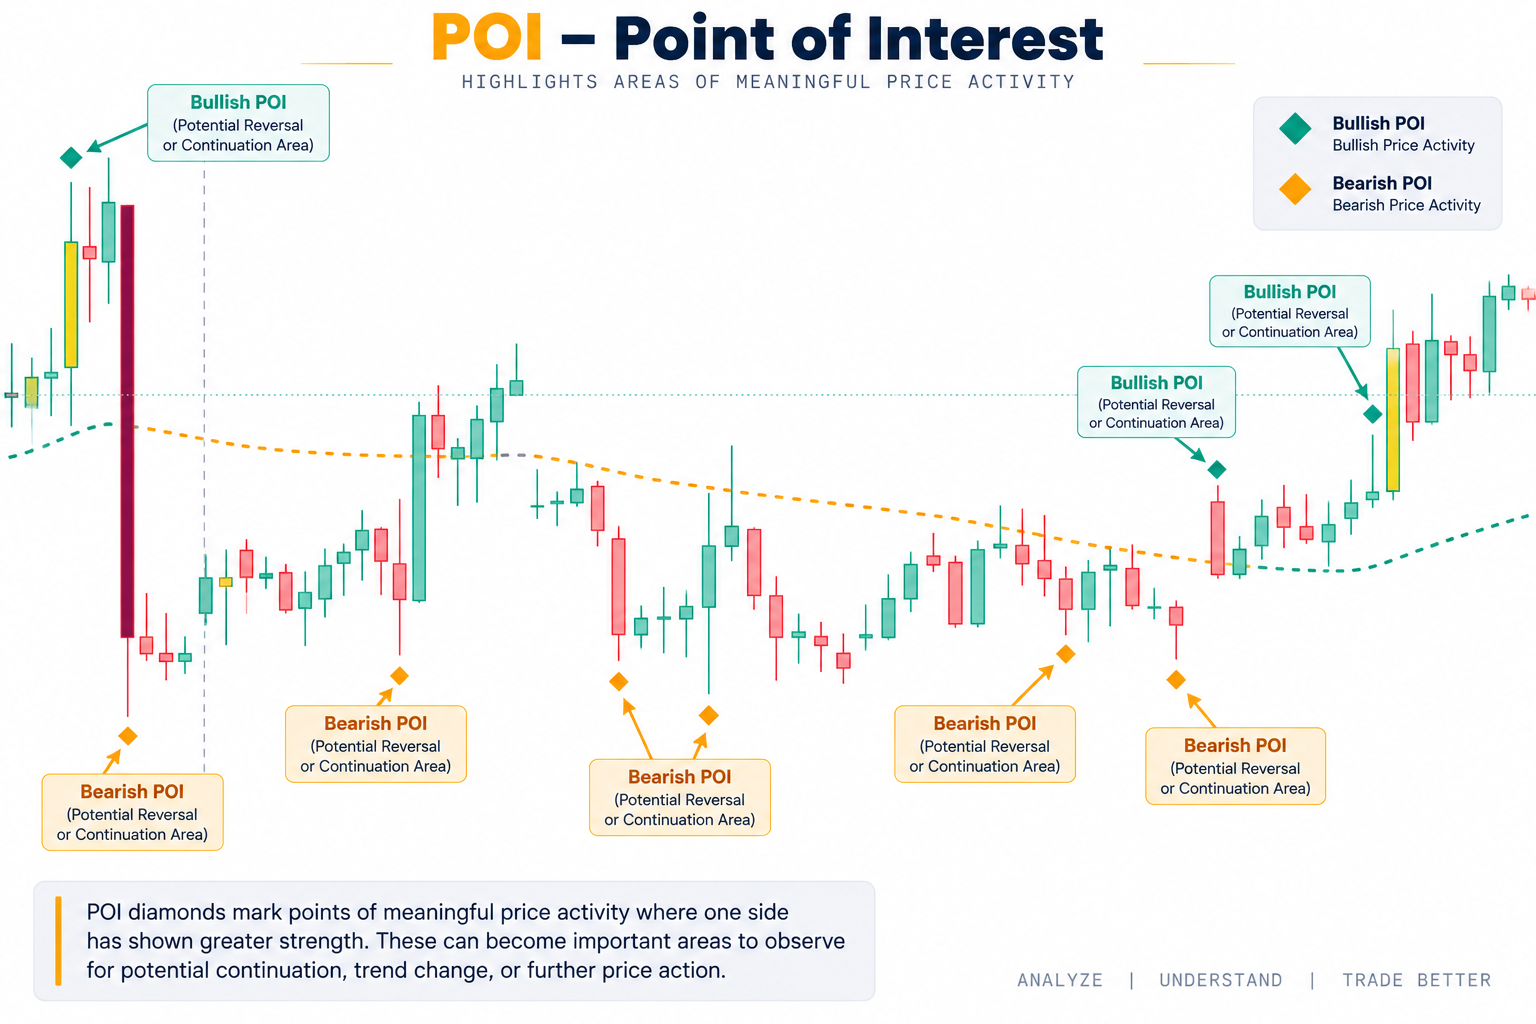
POI highlights important points of price activity where one side of the market has shown greater strength.
Teal Diamond → Bullish POI
Orange Diamond → Bearish POI
A Bullish POI highlights an area where bullish price activity has occurred, while a Bearish POI highlights an area where bearish price activity has occurred. POIs are points of interest, not automatic entry signals. They simply draw attention to areas where meaningful price activity has taken place. In simple terms: POI → Where important price activity occurred & which side showed strength.
2. POI Bar Color
POI also represents price activity through bar colors, providing another visual way to observe stronger price movement.
Yellow Bar → Bullish Price Activity
Maroon Bar → Bearish Price Activity
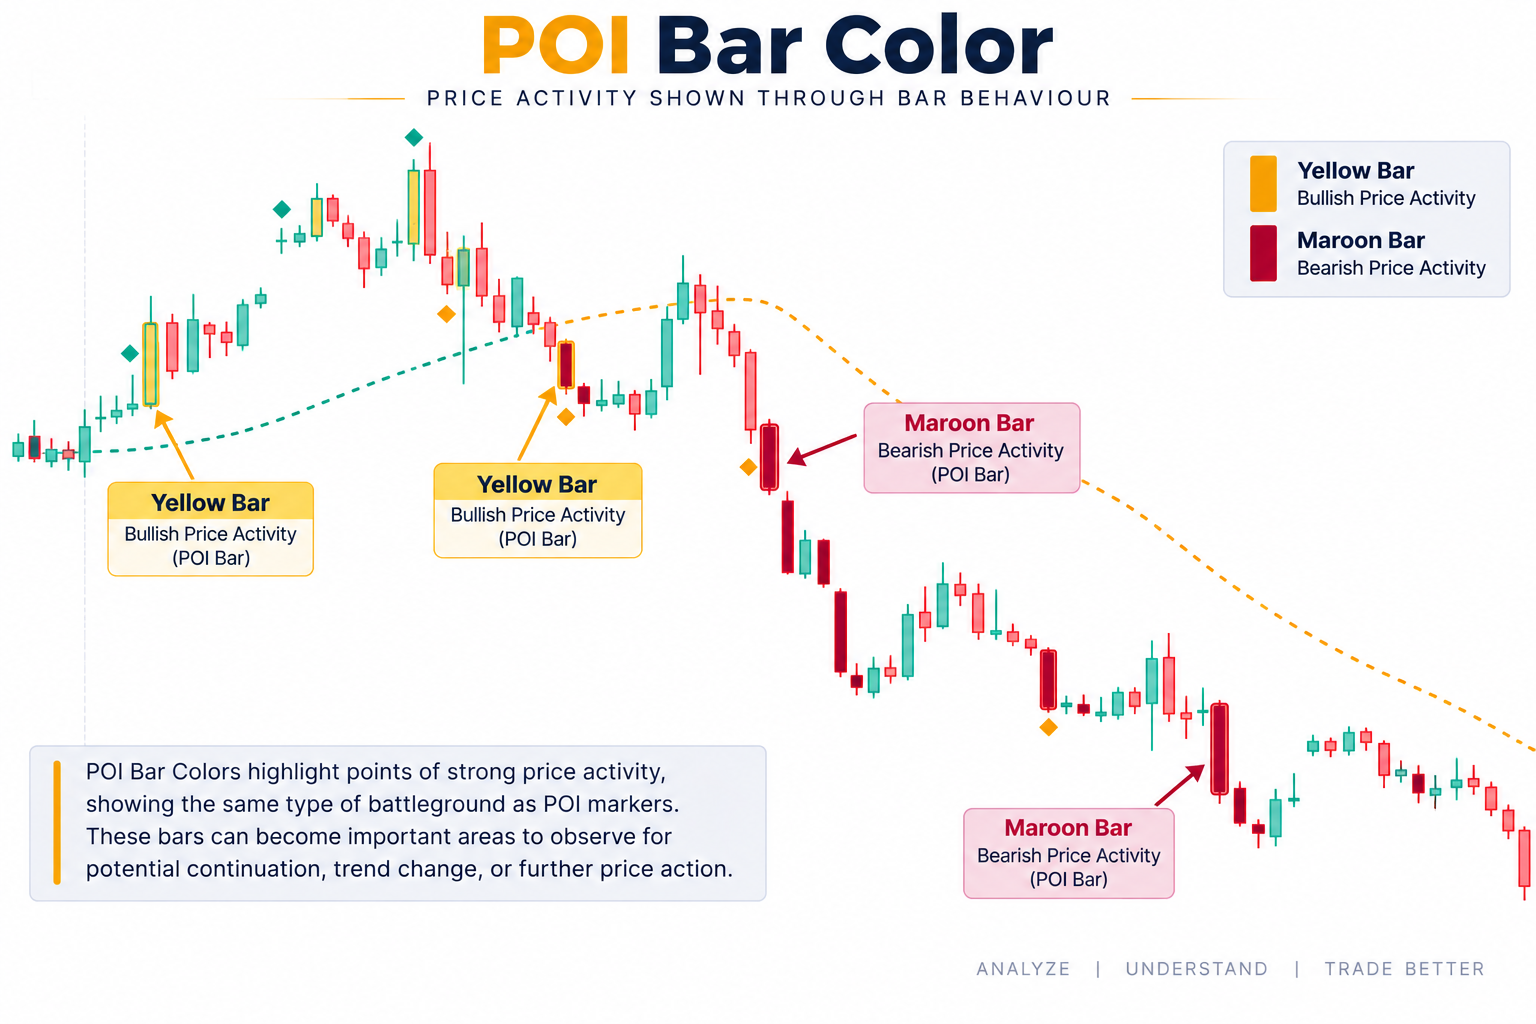
These bars highlight situations where price has moved beyond the previous range with stronger directional behaviour. Similar to the POI markers, these bars can be viewed as areas of meaningful price activity or battlegrounds between buyers and sellers, where one side has shown greater strength.
Such price points can become important areas to observe as the market develops, particularly when looking for potential continuation, trend change, or further price action.
The bar colors are designed to complement the POI markers and provide a quick visual reference directly through the price bars.
In simple terms: POI Bar Color → Price activity and potential battleground shown through bar behaviour.
3. SDI — Saarathi Direction Indication
SDI (Saarathi Direction Indication) provides the broader directional context of the market and is one of the strongest elements within the Saarathi analytical framework.
POI helps identify where meaningful price activity has occurred — an area where something important may develop. However, simply knowing the area does not tell us which side may have the advantage.
This is where SDI becomes important.
Price Above SDI → Long-side Bias
Price Below SDI → Downside Bias
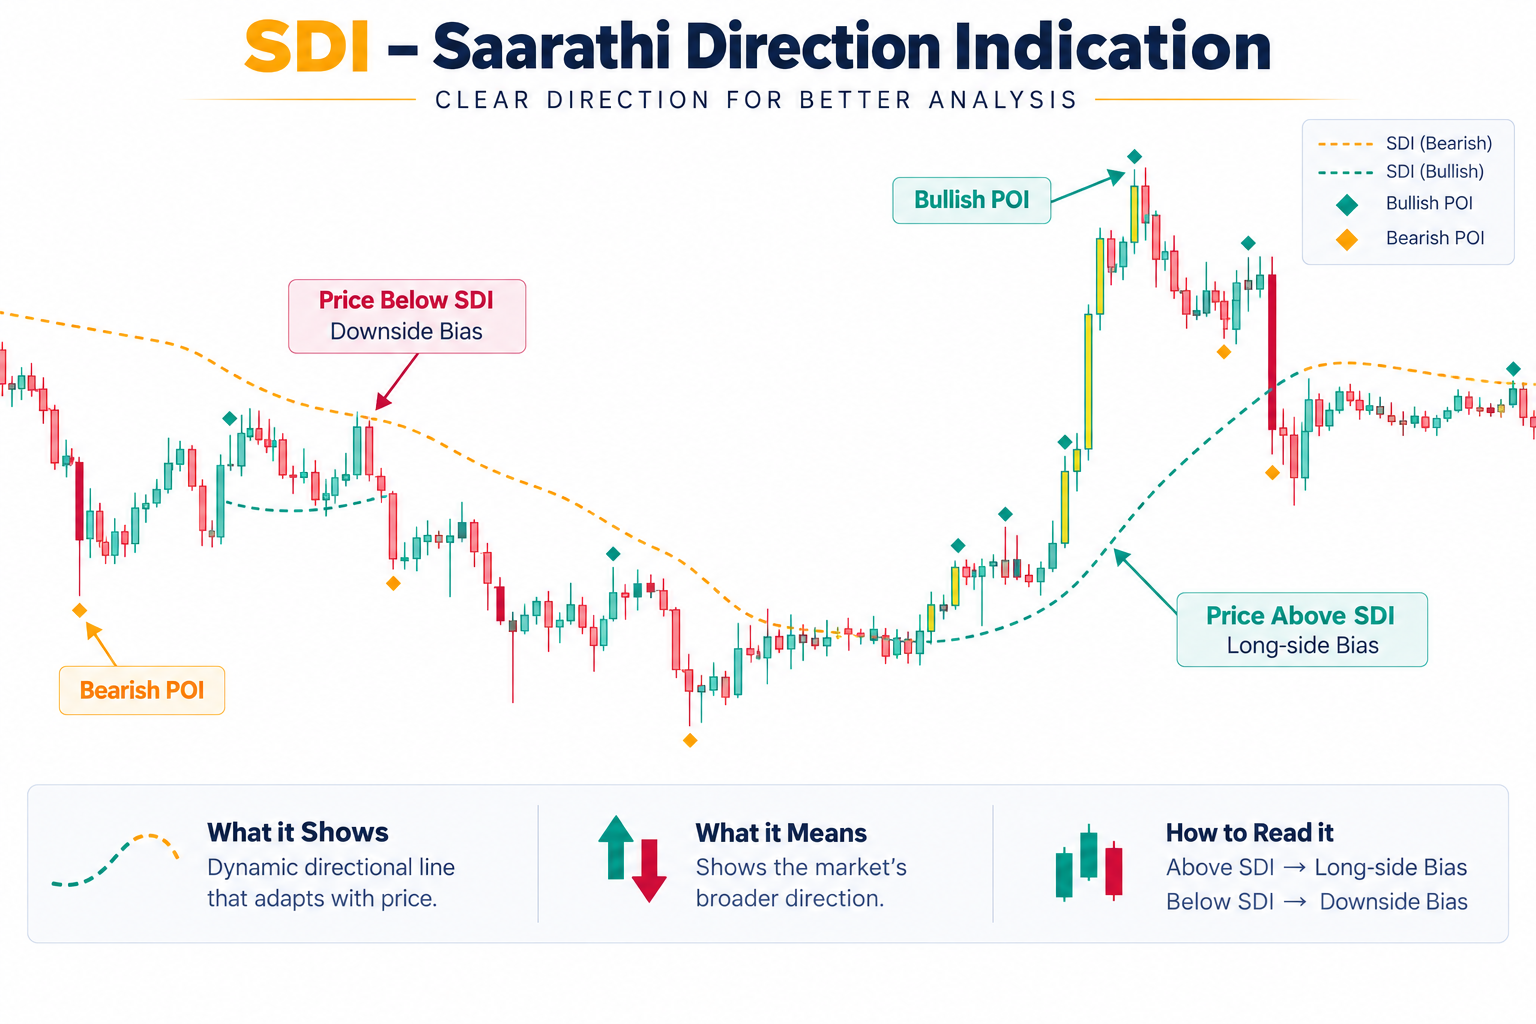
SDI helps bring directional context to the areas identified by POI, making it easier to understand whether the market is broadly favouring the bullish or bearish side.SDI is also a common component between POI and SMSI, although the two indicators use it within different analytical approaches.
In simple terms:
POI → Where meaningful activity is happening
SDI → Which direction the market is broadly favouring
4. Volatility Reference
Along with the main POI components, Saarathi indicators include a volatility reference displayed in the top-right corner of the chart.
This value is based on recent market volatility and provides an approximate reference for how much price may be expected to move under the current volatility conditions.
It is not a prediction or a fixed target. Instead, it gives the trader a quick sense of the market’s current movement potential and can be considered while planning and managing a trade.
In simple terms:
Volatility Reference → An approximate view of the market’s expected movement range.
Reading POI as a Framework
POI is most useful when its components are read together rather than in isolation. A POI identifies an area of meaningful price activity, POI Bar Color provides additional information through price behaviour, and SDI gives the broader directional context. The Volatility Reference adds an understanding of the market’s current movement potential.
Together, these elements help build a structured view of the market:
POI → Where is the important activity?
POI Bar Color → How is price behaving?
SDI → Which direction is being favoured?
Volatility Reference → What is the movement potential?
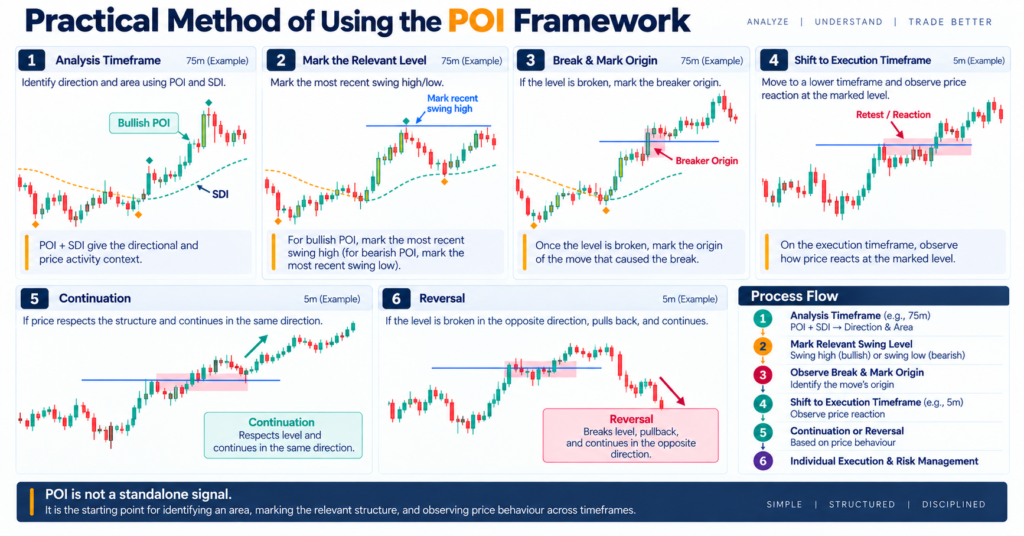
Practical Method of Using the POI Framework
The POI framework can be applied using a multi-timeframe approach, where the analysis or alert timeframe is used to identify the broader context, while a lower timeframe is used for execution.
For example, on a 75-minute timeframe, POI and SDI can be used to identify the direction and important price-activity area. Once the context is established, the relevant structure can be marked for further observation.
For a Bullish POI, the most recent relevant swing high can be marked. For a Bearish POI, the most recent relevant swing low can be marked.
If this level is subsequently broken, the origin of the move responsible for the break can also be identified and marked as an important reference area.
The analysis can then shift to a lower execution timeframe, where the market’s reaction around these marked levels can be observed.
This allows the framework to progress from:
Identify the Area → Mark the Structure → Observe the Break → Mark the Origin → Shift to Execution → Observe the Reaction
The important point is that POI provides the starting context, while the subsequent price behaviour around the marked levels helps determine whether the market is developing as a continuation or a reversal.
Continuation vs Reversal
This process also helps distinguish between a potential continuation and a potential reversal.
Continuation: Price respects the marked structure and continues in the same broader direction.
Reversal: Price breaks the marked level in the opposite direction, takes a pullback, and then continues further in that opposite direction.
In this way, POI is not treated as a standalone signal. It becomes the starting point for identifying an area, marking the relevant structure, shifting to a lower execution timeframe, and then observing the market’s reaction before making an individual trading decision.
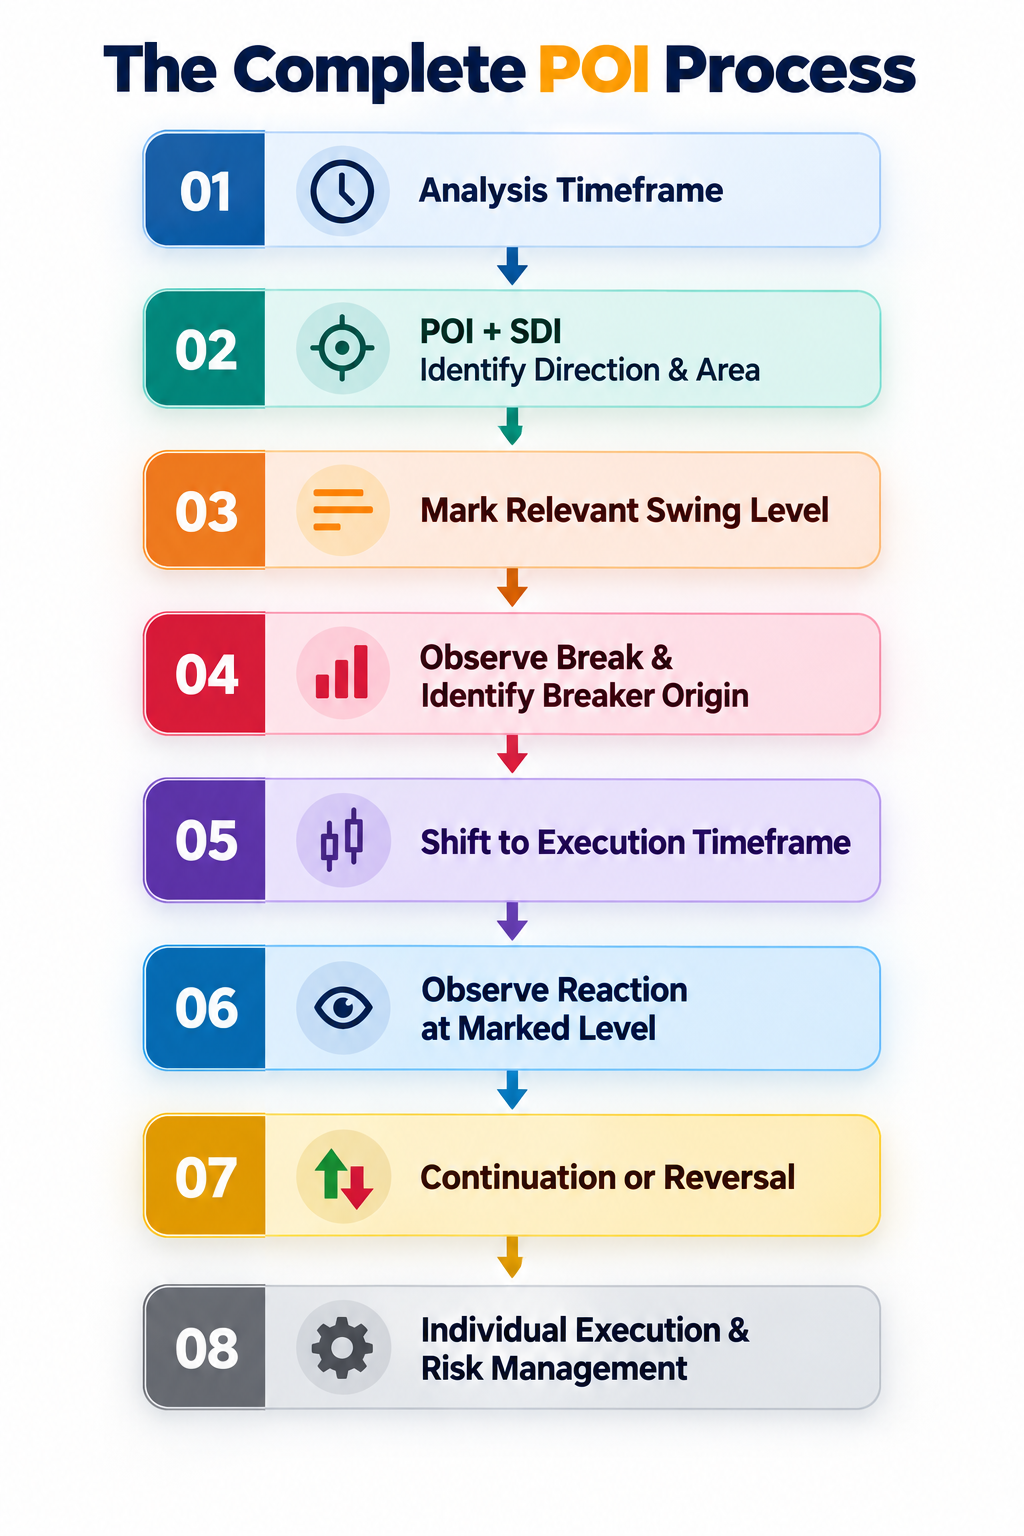
This process is based on our own backtested approach and can be used as part of market analysis. Analysis and execution are different parts of trading, so traders may use this framework for analysis while applying their own execution style, mindset, and risk-management approach. If the framework does not suit your trading style or you do not fully understand it, it is better to avoid using it — every method is not meant for everyone.
Practical Chart Examples
So far, we have understood the individual components of POI and how they can be combined into a structured framework. Now, let us look at how this framework can be read in real chart situations.
In these examples, we will observe POI, SDI, marked levels, and subsequent price behaviour together.
Example 1 — Continuation
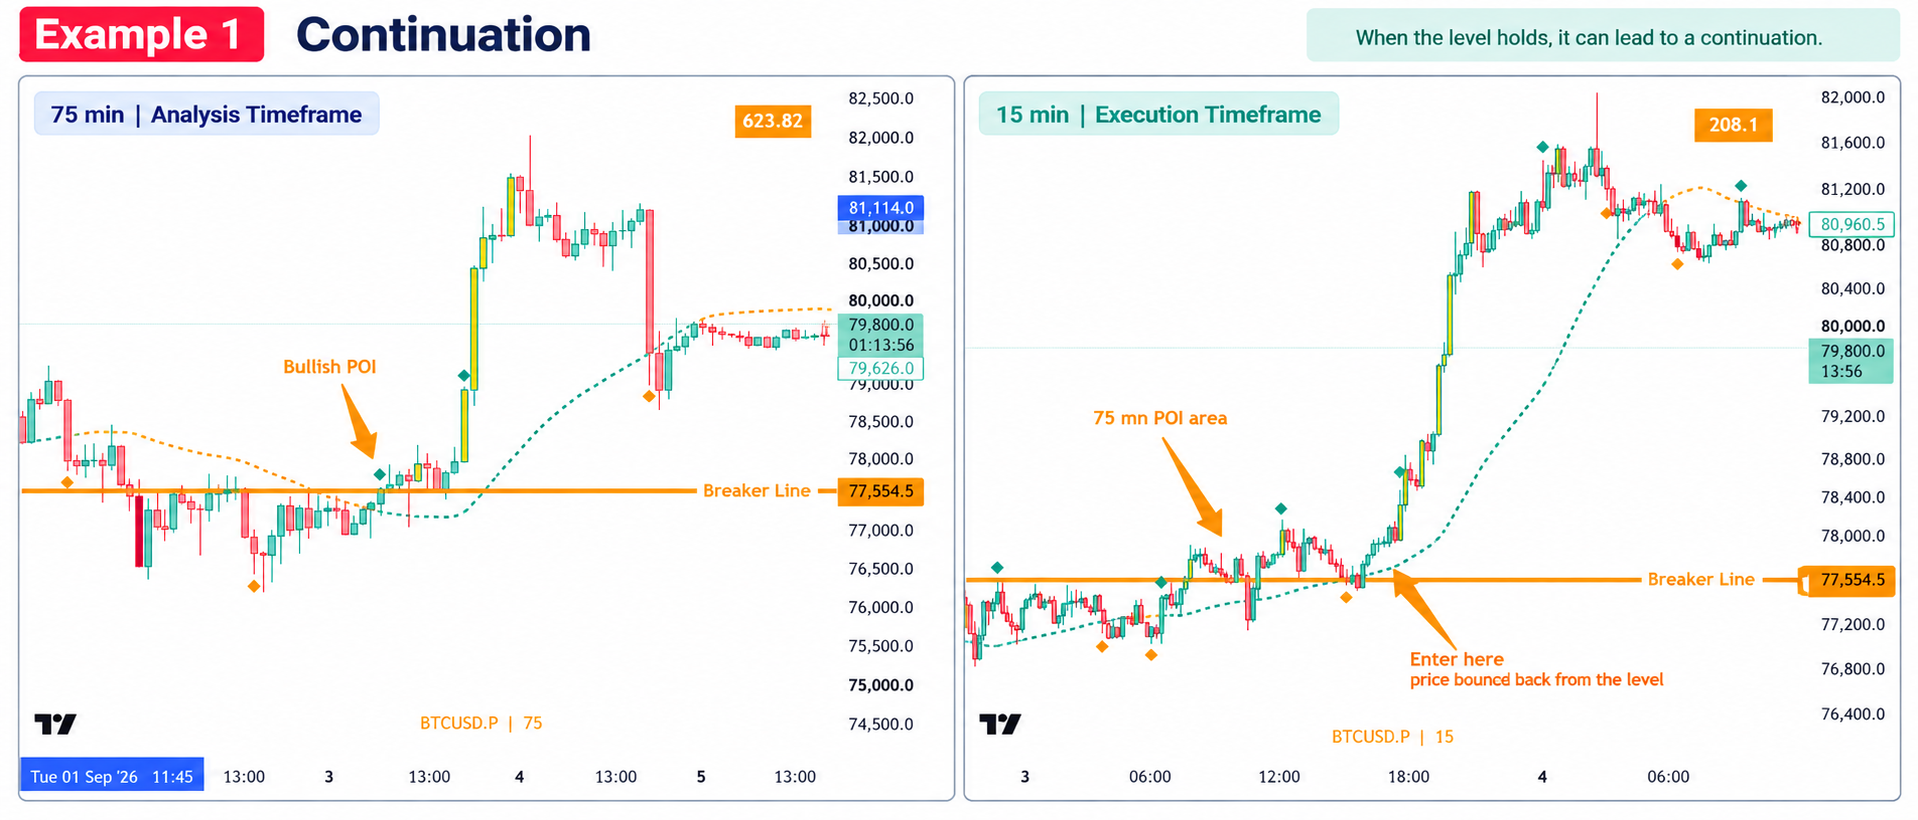
As discussed earlier, the first step is to identify where meaningful price activity may occur. In this example, we first identify a Bullish POI on the 75-minute analysis timeframe, giving us an area to watch.
The next question is which direction the market may favour. Price is trading above the SDI, giving the analysis a long-side directional bias.
With the area and direction identified, the next step is to mark the relevant level and wait for price to react around it.
We then move to the 15-minute execution timeframe. Here, price also remains above SDI and a Bullish POI develops around the same broader area. Price then reacts positively from the Breaker Line and SDI, bouncing upward from the marked level.
This example brings together the complete logic discussed in the framework:
Find the Area → Identify the Direction → Mark the Level → Wait for Reaction → Observe Continuation
The important point is that the POI did not act as a standalone entry signal. It helped identify the area of interest, while SDI provided the directional context and the lower timeframe price reaction provided additional information for execution.
Example 2 — Reversal
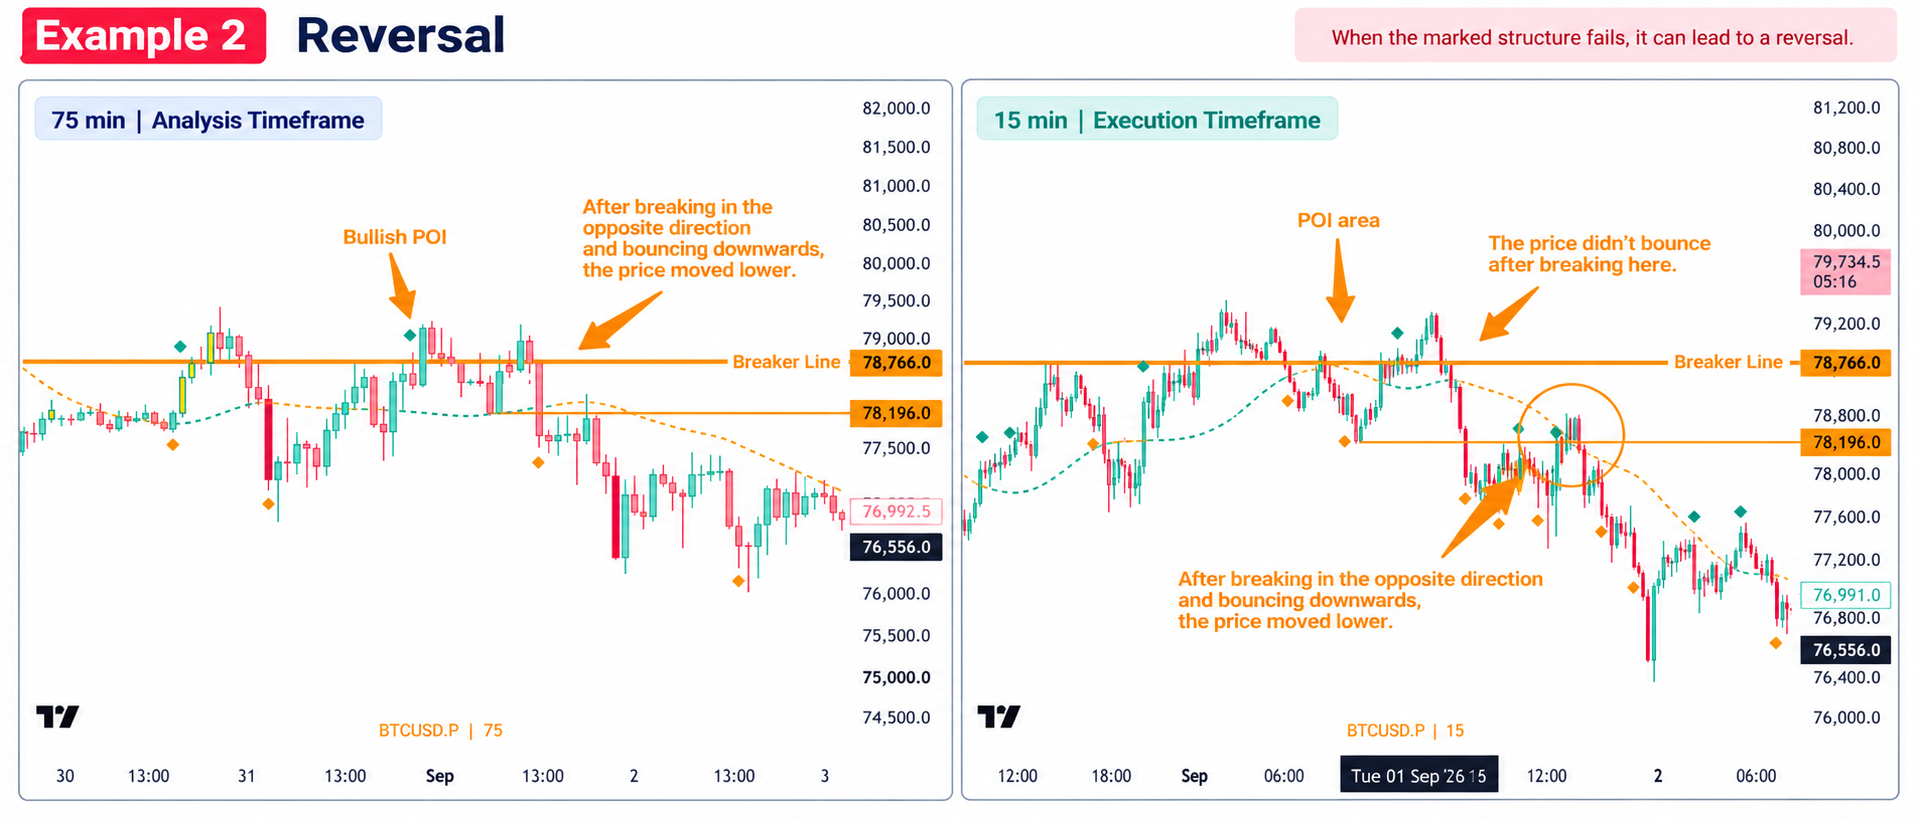
In this example, a Bullish POI is identified on the 75-minute analysis timeframe, giving us an area to watch.
The next question is which direction the market may favour. Price is initially trading above the SDI, giving the analysis a long-side directional bias.
We then mark the relevant Breaker Line and wait to see how price behaves around this level.
On the 15-minute execution timeframe, price reaches the POI area but fails to hold the marked structure. Instead of bouncing back upward, price breaks the level in the opposite direction and moves lower.
After the break, price attempts a recovery but fails to reclaim the important level and continues downward. This change in price behaviour provides the context for a potential reversal from the earlier bullish structure.
This example brings together the reversal logic discussed in the framework:
Find the Area → Identify the Direction → Mark the Level → Observe the Break → Wait for Pullback → Observe Opposite Continuation
The important point is that the Bullish POI did not guarantee bullish continuation. The subsequent break, failed bounce, and continued movement in the opposite direction are what changed the market context from a potential continuation to a potential reversal.
Important Clarification
POI is an analysis framework, not an entry or exit system.
It helps identify areas of meaningful price activity, provides directional context through SDI, and helps observe how price behaves around important levels. The actual trading decision should still depend on the trader’s own setup, confirmation, execution rules, and risk management.
A practical way to look at the process is:
Analysis → Confirmation → Own Setup → Execution → Risk Management
POI provides the analytical context. How that information is used for execution remains
the trader’s own decision and methodology.
Not every framework is suitable for every trader. Understand it first, test it within your own approach, and use it only if it fits your trading style and risk management.
Practical Takeaway
Identify the Activity → Understand the Direction → Observe the Reaction →
Build Your Own Decision Process
POI does not make the decision for you. It helps you build the context from
which your own trading decision can begin.
Final Thoughts | The Saarathi Ecosystem
SMSI was the first tool. POI is the second.
Both indicators approach the market differently, but the objective remains the same — to bring structure and clarity to market analysis.
POI adds another perspective to the Saarathi framework by focusing on
price activity, direction, and market behaviour.
And this is only the beginning. The Saarathi Ecosystem will continue to evolve with more tools, ideas, and frameworks designed to make market analysis more structured and practical.
Structured Analysis → Disciplined Execution
Thank You
Thank you for taking the time to explore the POI framework
and the ideas behind the Saarathi Ecosystem.
We hope this framework helps you look at the market with more structure, clarity, and confidence.
Keep learning, keep testing, and most importantly — build a process that works for you.
— Team Saarathi Analytics