Price Action Analysis is one of the most powerful trading methods used in the stock market. It focuses on analyzing raw price movement on charts without depending heavily on indicators.
Instead of using multiple technical indicators, price action traders study:
- Candlestick behavior
- Market structure
- Support & Resistance
- Breakouts & Rejections
- Trend direction
- Buyer & Seller psychology
Price Action trading is widely used by professional traders because it helps them understand how the market is actually moving in real time.
What is Price Action?
Price Action is the movement of a stock’s price over time shown on a chart.
It studies how buyers and sellers interact at important price levels to predict future market direction.
Price Action traders believe:
- Price reflects everything
- Charts reveal market psychology
- Clean charts are more effective than too many indicators
Main Components of Price Action Analysis
1. Market Structure
Market structure helps identify trend direction.
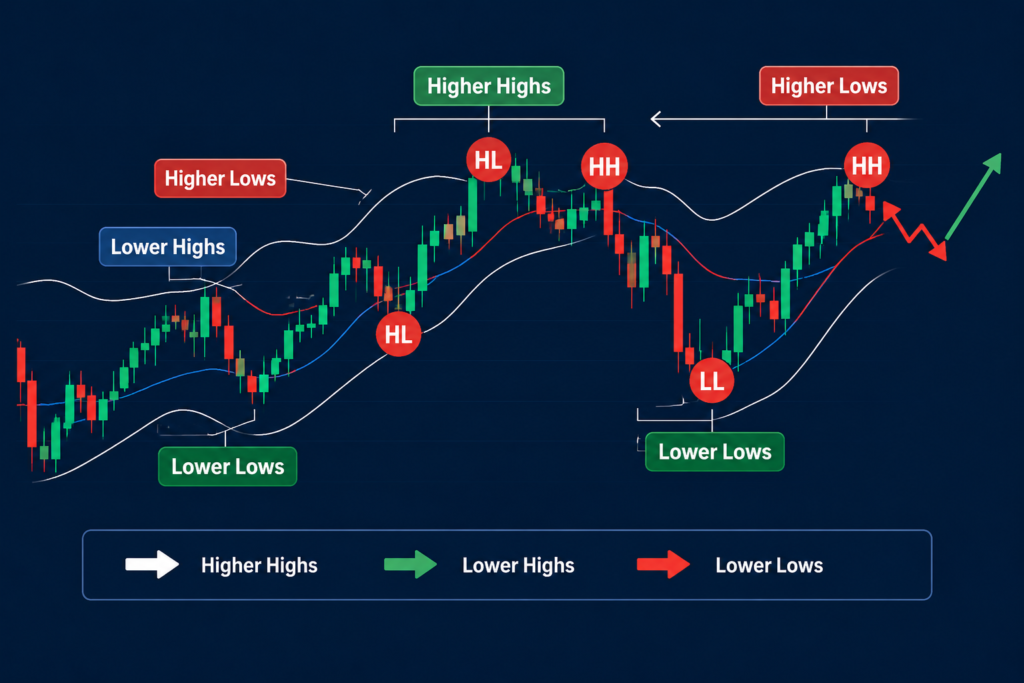
Bullish Structure
- Higher Highs
- Higher Lows
📈 Indicates buying strength.
Bearish Structure
- Lower Highs
- Lower Lows
📉 Indicates selling pressure.
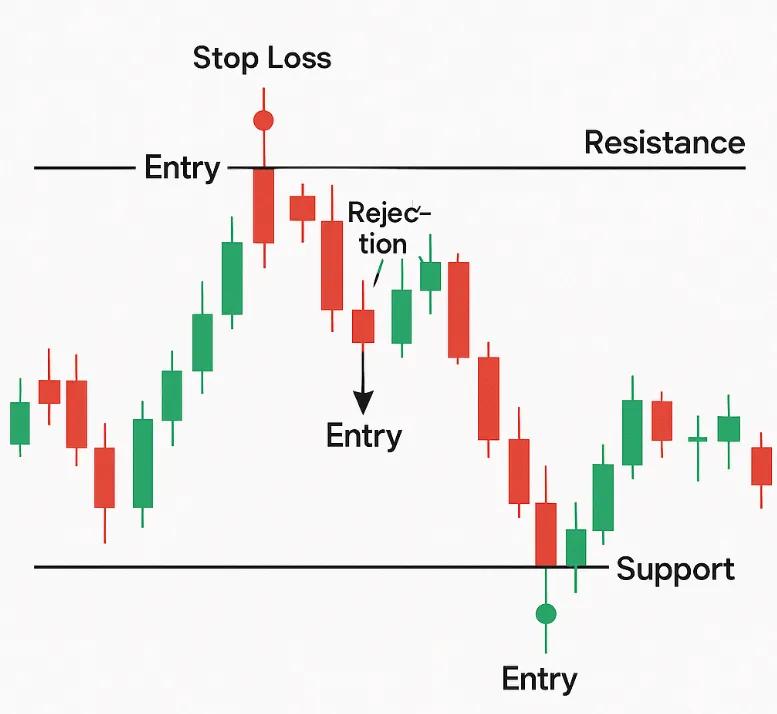
2. Support & Resistance
Support
A price zone where buyers become active.
Resistance
A price zone where sellers become active.
These levels are very important in price action trading because reversals and breakouts often happen there.
3. Candlestick Analysis
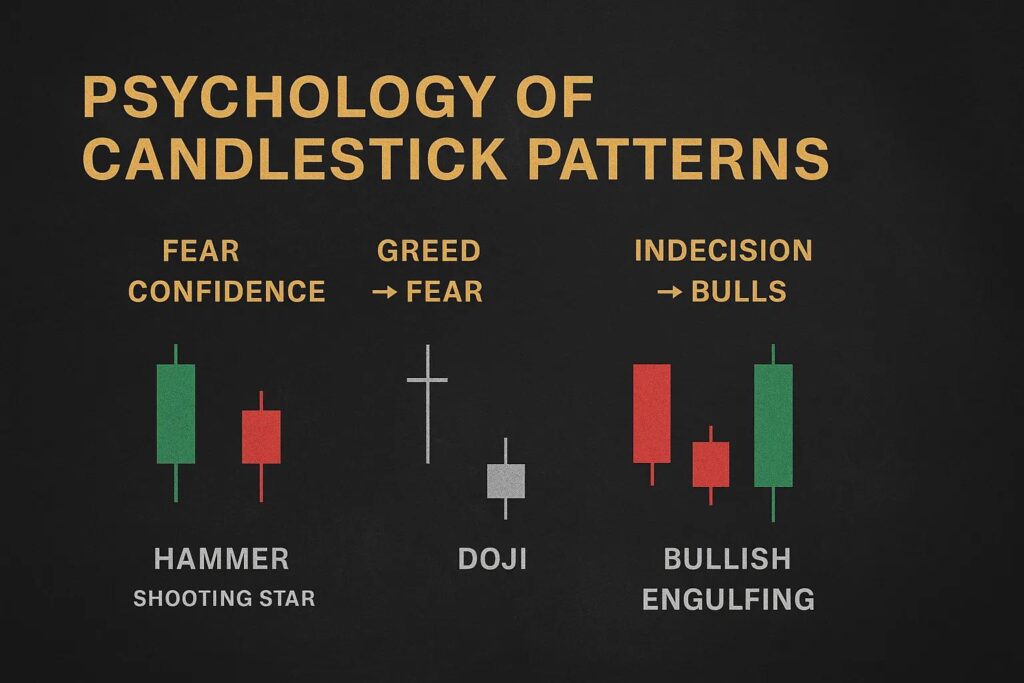
Candlesticks show market psychology and momentum.
Popular price action candles:
- Doji
- Hammer
- Shooting Star
- Engulfing Candle
- Pin Bar
These candles help traders understand buyer and seller strength.
4. Breakouts & Rejections
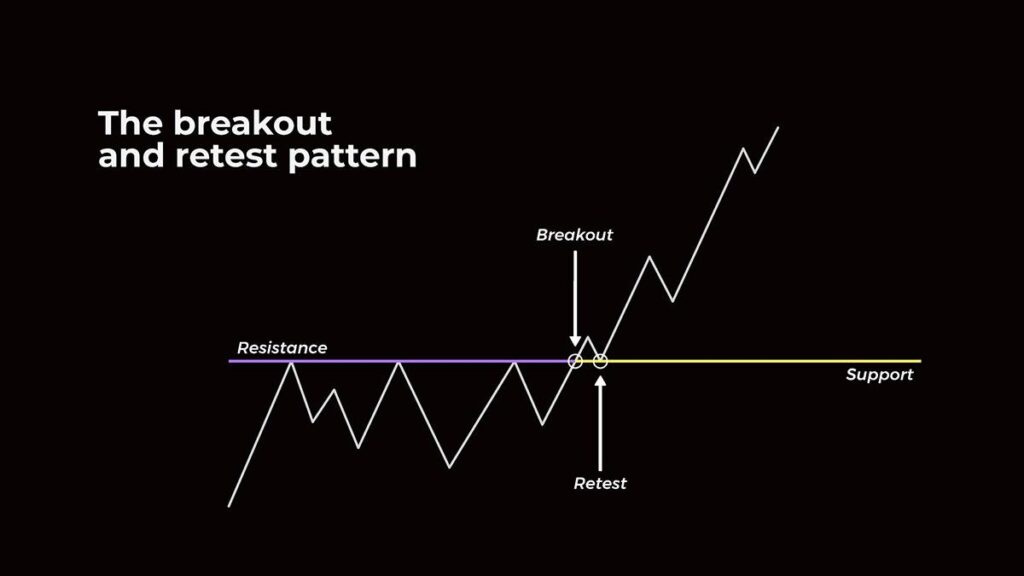
Breakout
When price moves strongly above resistance.
Rejection
When price fails to cross a level and reverses.
Price action traders use these signals for entries and exits.
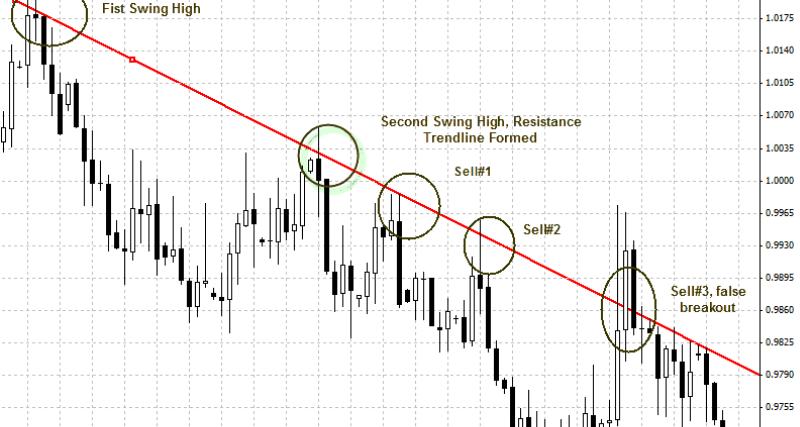
5. Trendlines
Trendlines connect important highs or lows to identify market direction.
They help traders:
- Spot trends
- Find breakout areas
- Identify support & resistance zones
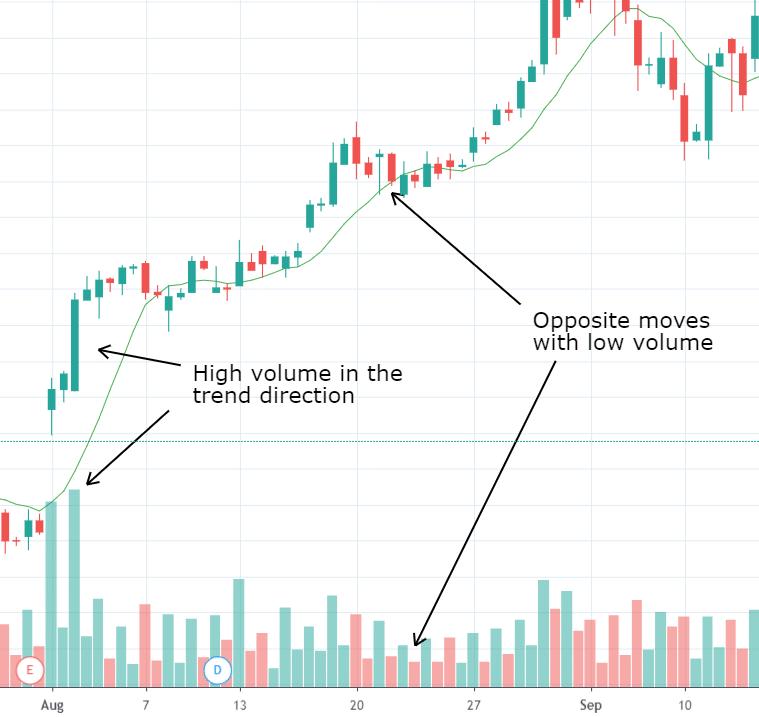
Importance of Volume in Price Action
Volume confirms whether a move is strong or weak.
- High volume = Strong breakout
- Low volume = Weak movement
Professional traders often combine volume with price action for better accuracy.
Advantages of Price Action Trading
Clean and simple charts
Helps understand market psychology
Works in all markets
Useful for intraday and swing trading
Reduces dependency on indicators
Limitations of Price Action
Requires practice and experience
Different traders may interpret charts differently
False breakouts can occur
Emotional trading can still affect decisions
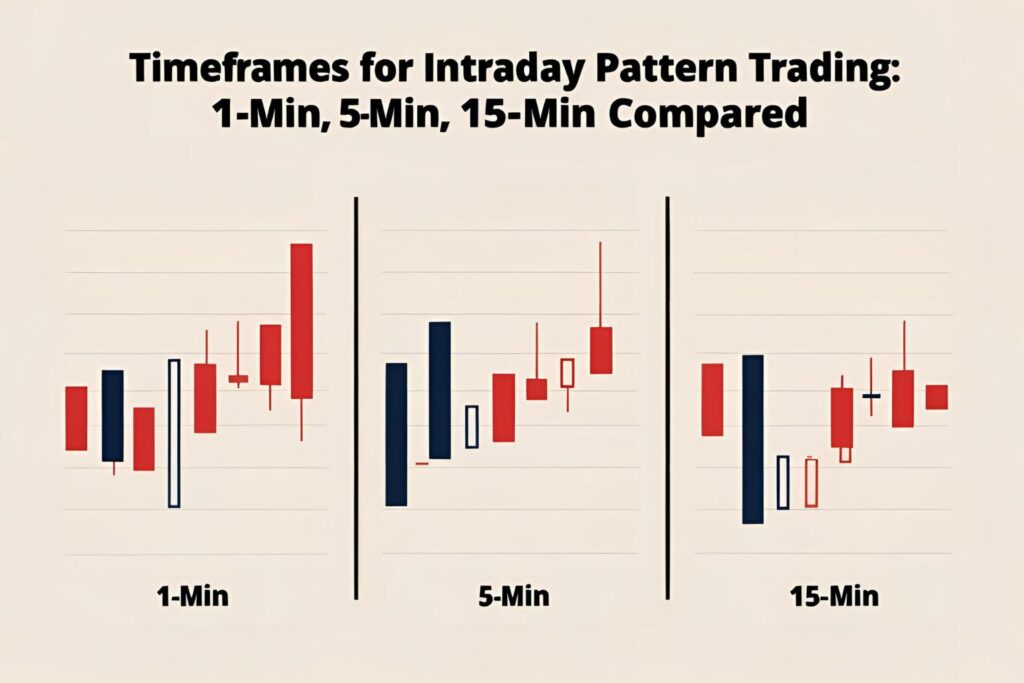
Best Timeframes for Price Action
- 5-Minute Chart → Scalping
- 15-Minute Chart → Intraday Trading
- 1-Hour Chart → Swing Trading
- Daily Chart → Positional Trading
Many traders use multi-timeframe analysis for better confirmation.
Conclusion
Price Action Analysis is one of the purest forms of technical analysis. It helps traders understand market structure, buyer-seller behavior, and trend strength directly from charts.
Successful price action trading requires:
- Patience
- Discipline
- Risk management
- Consistent practice
Professional traders often say:
“Price is the final truth of the market.”
By mastering price action, traders can improve their market understanding and make more confident trading decisions.