In trading, understanding direction is only one part of analysis. It is equally important to understand where price is reacting, which side is showing strength, and how momentum is developing.
Saarathi 2.47 – Dynamic Zones is designed around this approach. Its main component, Dynamic Zones, highlights important demand and supply areas that adapt with price behaviour. When price returns to these zones, the reaction and behaviour around the area can be observed
and used as part of the trading plan.
Momentum Bars help identify which side — buyers or sellers — is showing stronger activity, while SMI – Saarathi Momentum Indication provides additional context about momentum and strength.
Together, these components create a simple framework:
Dynamic Zone → Price Behaviour → Momentum → Strength → Decision
The objective is not to provide a standalone entry or exit signal, but to make
market analysis more structured and easier to understand.
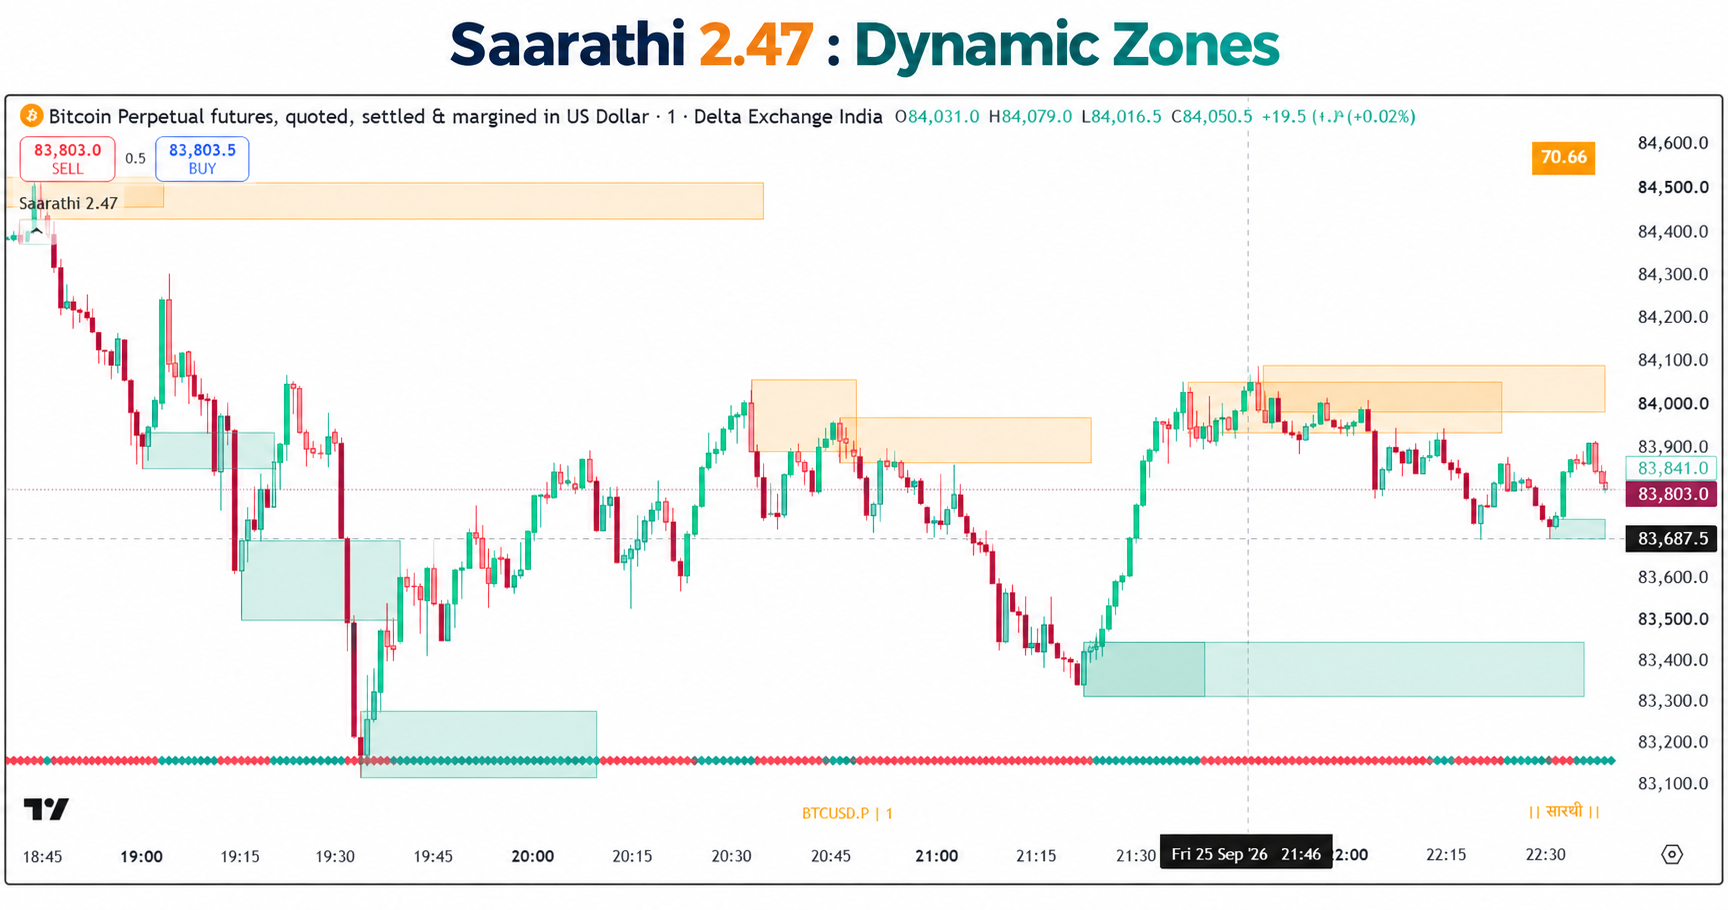
Understanding the Components
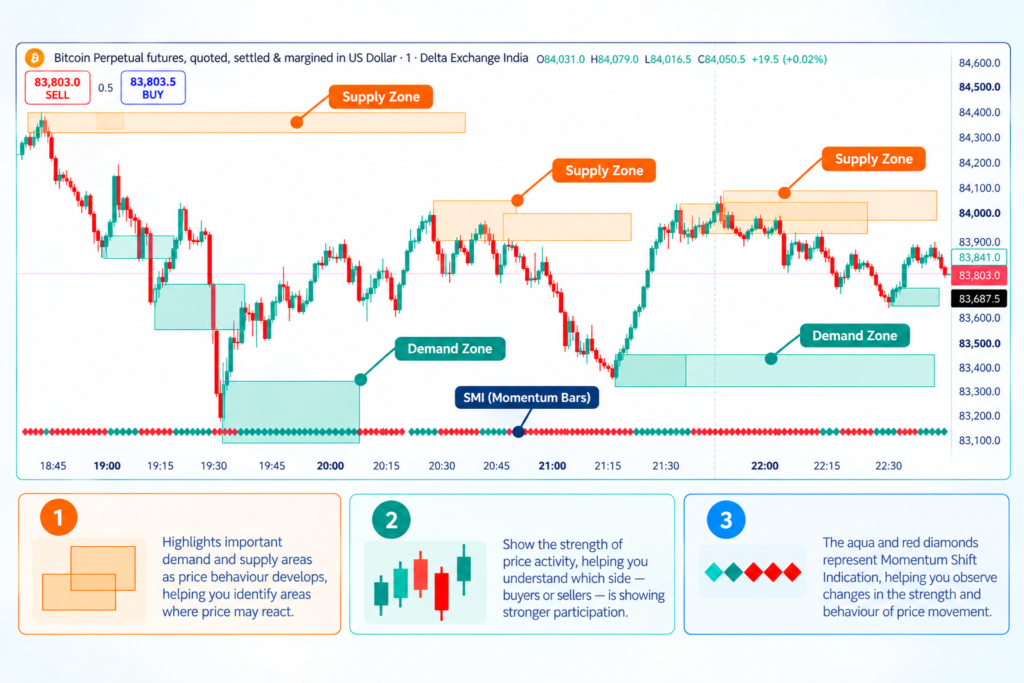
Saarathi 2.47 – Dynamic Zones is built around three main components that work together to provide a clearer view of market behaviour:
1. Dynamic Zones
The main component of the indicator. Dynamic Zones highlight important demand and supply areas as price behaviour develops, helping traders identify areas where price may react.
2. Momentum Bars
Momentum Bars show the strength of price activity and help understand which side — buyers or sellers — is showing stronger participation.
3. SMI – Saarathi Momentum Indication
The teal and red diamonds represent Momentum Shift Indication, helping observe changes in the strength and behaviour of price movement.
Together, these components provide a simple way to read:
Zones → Price Behaviour → Strength → Confirmation → Execution
1. Dynamic Zones
Dynamic Zones are the main component of Saarathi 2.47. They highlight important key areas where price may react. Based on price behaviour, the indicator creates Bullish and Bearish Zones.
When price returns to a zone, the way the next candle or price movement reacts around that area becomes an important part of the analysis. This provides the first indication
of what may be happening in the market.
From there, the other components of Saarathi 2.47 — such as Momentum Bars and SMI — can be used to understand the strength and confirmation before planning an execution.
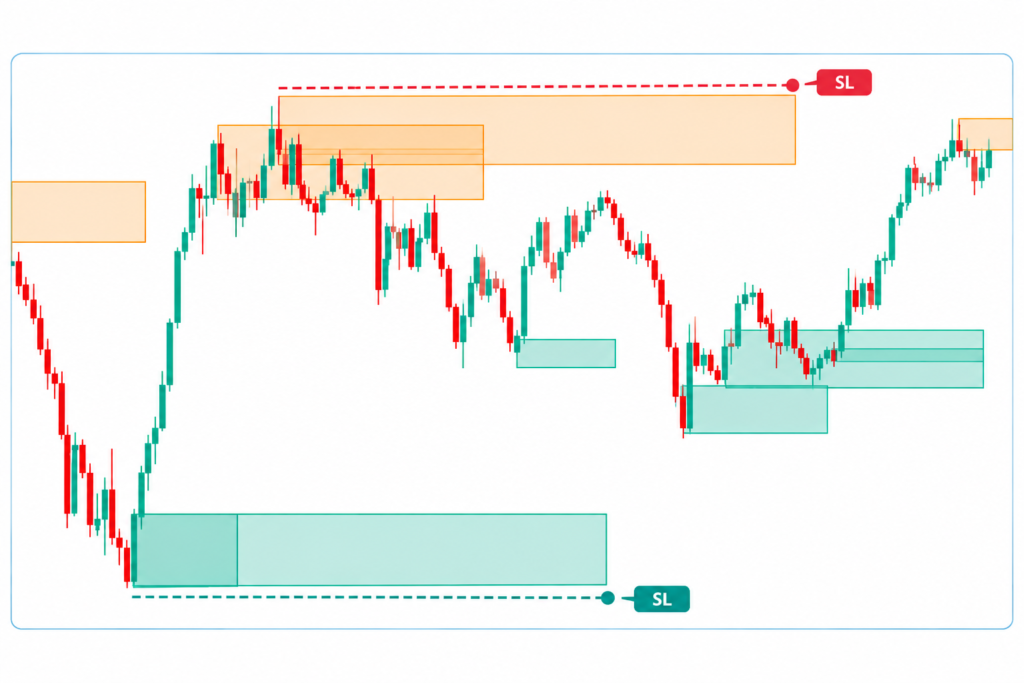
Dynamic Zones can also remain useful after a trade is executed. They can help in managing the trade, including planning exit areas and stop-loss levels.
For example:
Bullish Trade: The low of the Bullish Zone can be considered as a stop-loss reference, with an appropriate buffer.
Bearish Trade: The high of the Bearish Zone can be considered as a stop-loss reference, with an appropriate buffer.
2. Momentum Bars
Momentum Bars help us understand the strength and direction of current price activity. They show which side — buyers or sellers — is currently showing stronger participation.
Dynamic Zone humein important area batata hai, while Momentum Bars help us understand what is happening inside that price movement.
Dynamic Zones can also remain useful after a trade is executed. They can help in managing the trade, including planning exit areas and stop-loss levels.
For example:
Bullish Trade: The low of the Bullish Zone can be considered as a stop-loss reference, with an appropriate buffer.
Bearish Trade: The high of the Bearish Zone can be considered as a stop-loss reference, with an appropriate buffer.
2. Momentum Bars
In trading, a trade plan usually begins with three important questions:
Where is the Area of Interest? → What is the Direction? → What confirms the idea?
Dynamic Zones help identify the Area of Interest — the areas where price behaviour becomes important and where we can start building a trading decision.
Once price reaches that area, the next step is to observe how price reacts. This is where Price Action and Momentum Bars become important.
Momentum Bars provide a visual indication of the direction and strength of the current price movement. Green represents bullish momentum, while maroon represents bearish momentum.
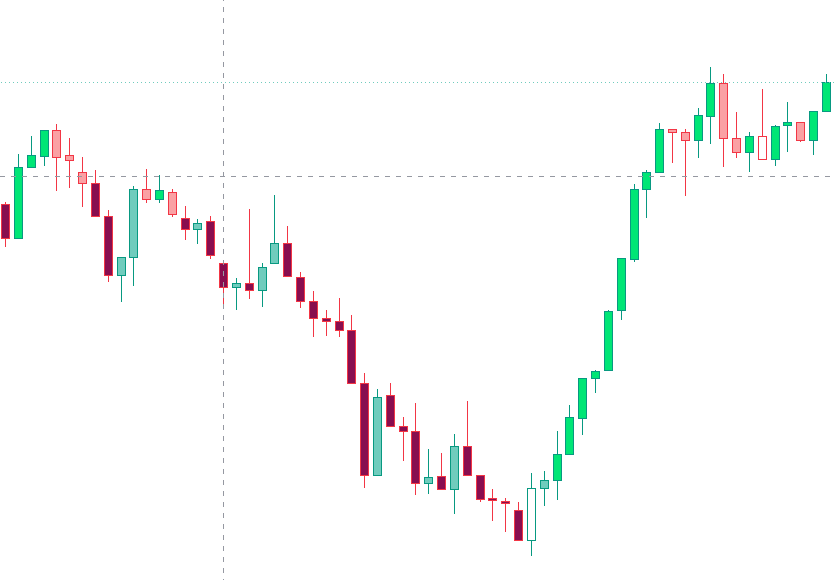
For example, when price reacts from a zone and then develops a swing, breakout, pullback, or follow-up move, Momentum Bars help us observe whether that movement is continuing with strength or losing momentum.
They can also be read together with candle patterns and price action to build better confirmation. This combination can help in deciding whether a setup is developing as expected and whether the existing momentum is strong enough to continue riding the trade.
The important point is that Momentum Bars should not be treated as a standalone buy or sell indication. Their real value comes from reading them in the context of the Zone, Price Action, and Direction.
3. SMI — Saarathi Momentum Indication
The teal and red diamonds near the bottom of the chart represent SMI — Saarathi Momentum Indication. SMI helps us observe changes in the strength and behaviour of the current price movement.
Teal Diamonds represent bullish momentum, while Red Diamonds represent bearish momentum. When the indication shifts from one colour to another, it highlights a possible change in momentum.
This shift does not automatically mean a reversal. Price may continue in the same direction, pause, move sideways, or eventually establish a new direction.
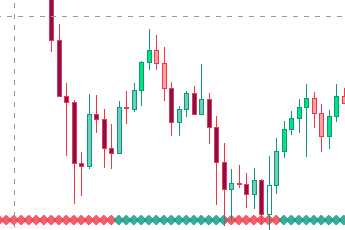
For an existing trade, the shift can help us reassess the trade, manage risk, or consider profit booking according to our trading plan. For a new setup, it can be a reason to wait, observe the transition, and look for confirmation before execution.
The important point is that SMI is not about predicting the next move. It is about becoming aware that the current momentum may be changing.