From Framework to Real Market Examples
In Part 1, we explored the different components of SMSI, and in Part 2,
we brought them together into a practical framework.
Now, let’s see how this framework looks on actual charts and different market situations.
In this part, we will look at real chart examples and observe how the market develops —
whether a move is continuing, transitioning, or reversing —
and how the SMSI framework can help us read these changes.
We will also look at situations where a trade is already in progress and see how the framework can help us monitor the position as market behaviour develops. The purpose is simple:
to take what we discussed in the previous parts and see how it looks in real market situations.
To make it easier, we will divide the examples into two main categories.
The First category, Trade Management, will focus on Managing an Existing Trade and observing how the SMSI framework can help as market behaviour develops after a position has already been taken.
The Second category, Trade Opportunities, will focus on situations where a trader is looking for a new opportunity. Here, we will look at both Continuation Situations and Reversal Situations.
We will look at practical examples for each situation, allowing us to see how the framework behaves across different market conditions rather than relying on a single example.
1. Trade Management : Managing an Existing Trade
Using SMSI After Entering a Trade
Finding the right direction and planning an entry is only one part of trading. Another important challenge begins after the trade has been taken — when to hold, when to book profit, and when to accept that the move is losing strength.
A fixed risk-to-reward plan can provide a clear target. But market behaviour does not always move directly toward that target.
When the Trade Is Already in Profit
Suppose a trader enters a trade with a 1:3 risk-to-reward setup. Price moves in the expected direction and reaches around 1:2, but then the momentum starts slowing down. If the SMSI framework begins showing Neutral or opposite momentum, this can become an important point to reassess the position.
Instead of simply waiting for the original 1:3 target, the trader may choose to protect the profit or book it, depending on their own trading methodology and risk management.
The reason is simple: we cannot know in advance how long a correction may last or how deep it may become. During a prolonged correction, the position can remain open while capital stays committed to the trade. In some situations, the correction may eventually reach the stop-loss even though the original direction later resumes.
Direction Is Not Enough — Strength Matters Too
This is where the SMSI framework can provide another layer of information.
Direction → Where is the market moving?
Momentum → How strong is that movement?
Neutral / Shift → Is that strength beginning to change?
If the direction remains supportive but momentum starts weakening, the trader gets an opportunity to reassess the position instead of treating the original entry as permanently valid.
If the framework later shows that the original direction is regaining strength and the continuation conditions develop again, the trader can evaluate a new opportunity according to their own methodology.
A Practical Approach to Trade Management
The framework can therefore help create a more systematic way of managing an open position:
Enter → Monitor Direction & Momentum → Observe Strength → Reassess → Hold, Book Profit, or Exit
The objective is not to predict exactly how far a correction will go.
It is to recognize when the strength supporting the existing trade begins to change, so the trader can make a more informed decision about the position.
This is where SMSI can be useful not only for finding a trade, but also for guiding the trade after entry.
Examples :
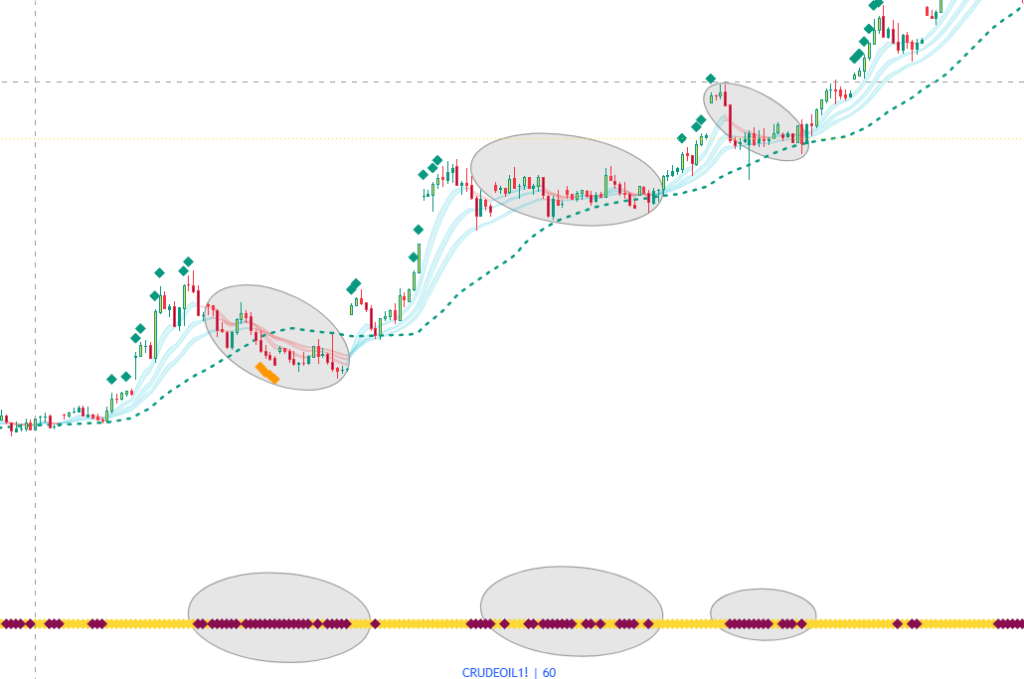
Trade Management — When a Correction Turns Into a Long Range
After a strong directional move, price may lose momentum and enter a range or prolonged correction instead of continuing immediately. During such phases, the direction may remain uncertain while capital stays committed to the position.
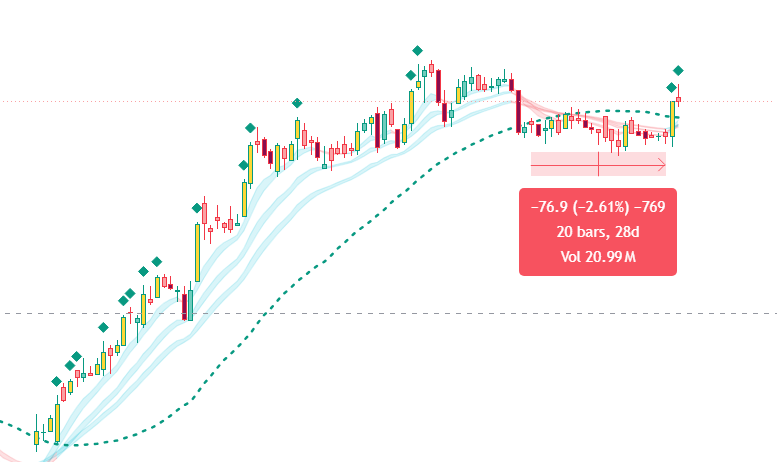
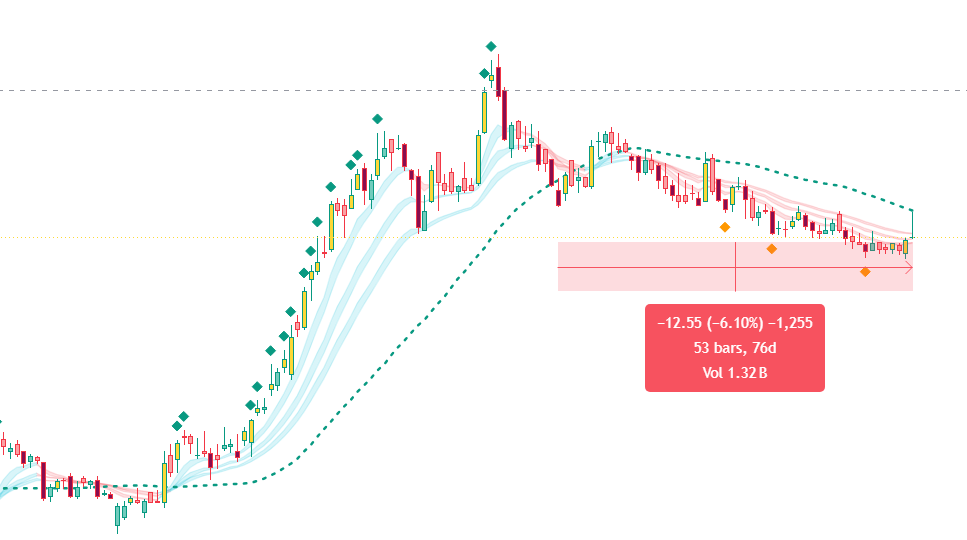
In both examples, the price remained within a range for an extended period — approximately 20 bars / 28 days in one case and 53 bars / 76 days in the other. We cannot know in advance how long such a phase will last or whether it will eventually turn into a new trend.
Why This Matters
For a trader, the challenge is not always a loss. A position can remain relatively stable while the capital stays committed for weeks or months, potentially limiting the ability to participate in other opportunities.
This is where the SMSI framework can provide useful context. The Momentum Shift Indication helps observe whether the previous momentum has weakened, while the Multi-Timeframe Dashboard helps identify whether the broader timeframes are still supporting the original direction or have moved into a more neutral or changing phase.
This allows the trader to recognize that the market has entered a different phase from the original strong directional move.
Managing the Position
Depending on the trader’s own methodology and risk management, this may become a point to reassess the position.
The trader may choose to:
Continue holding → if the original direction and strength remain supportive.
Book or reduce → if momentum has weakened and capital may be better utilized elsewhere.
Exit → if the original trade thesis is no longer valid.
For experienced derivatives traders, another possible approach is to use an opposite-direction derivatives position as a hedge, while keeping the original position open. This may help reduce the impact of an adverse move during a prolonged correction or sideways phase, but it involves additional risks, costs, and margin requirements.
The Practical Takeaway
Trade management is not only about protecting a trade from a loss. It is also about recognizing when capital is tied up while the market is no longer behaving as expected.
The framework helps keep direction, momentum, and market phase under observation, giving the trader another reference when deciding whether to hold, reduce, exit, or manage the position differently.
2. Trade Opportunities
Through these examples, we will see how the framework can be applied to identify and evaluate a developing trade opportunity.
Continuation Situations : Example
The market had already established a bullish structure, with price trading above the SDI and holding above the bullish Breaker Line and Territory Line.
At this stage, the broader market environment was still supportive of the bullish direction. The move had already developed, but price then started showing signs of a pause and correction.
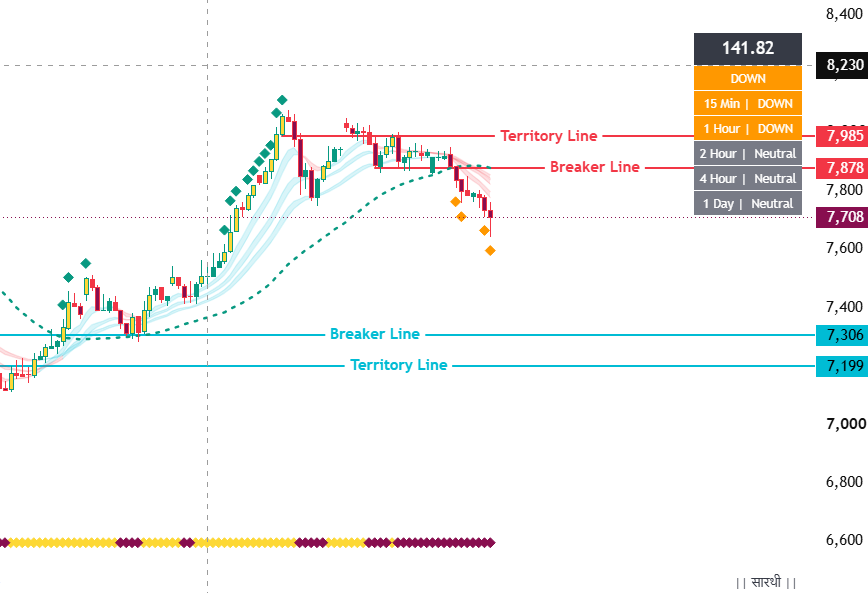
Price Behaviour Begins to Change
At the same time:
- A bearish Trigger Point has appeared.
- A Bearish Momentum Shift has developed.
- The EMA Bands have turned bearish.
- The shorter selected timeframes have moved toward the bearish side.
- The higher timeframes are still showing Neutral conditions.
At this stage, the established bullish move is showing a temporary loss of strength and corrective behaviour. The important point is that the broader bullish structure has not simply disappeared because these short-term conditions changed. The market is showing a period of weakness within the previously established bullish environment.
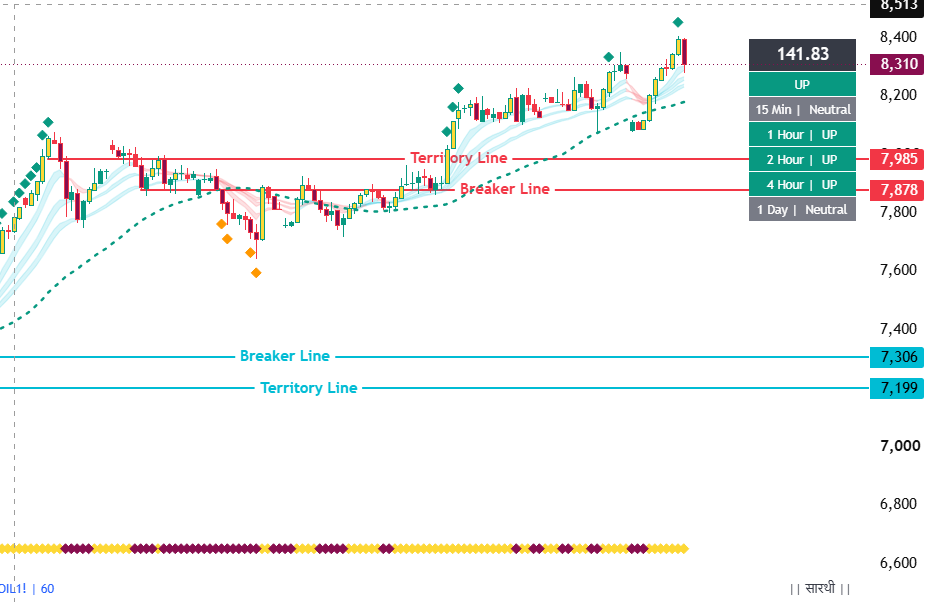
How Did the Move Develop Further?
The second chart shows what happened as price continued to develop from this point. Price recovered from the corrective phase and started moving back toward the bullish side. The Dashboard conditions improved, with the higher timeframes returning toward UP conditions. The EMA Bands also shifted back toward bullish behaviour, while the overall price structure again supported the upward move.
The earlier bearish conditions therefore developed as a temporary corrective phase, rather than becoming a complete reversal of the established bullish trend. The bullish move eventually resumed, with the different components once again showing stronger alignment toward the upside.
What This Example Shows
This example demonstrates how an established trend can temporarily lose strength without immediately becoming a reversal.
In the first chart, the framework helped us identify the change in behaviour and corrective phase.
In the second chart, the subsequent price behaviour and the supporting SMSI components showed that the bullish move had resumed.
The value of the framework here is not in predicting that the correction would end. It is in helping the trader observe the change, follow its development, and recognize when the original direction begins to regain strength.
Continuation Situations : Example
The market had already established a bearish structure, with price trading below the SDI and the broader Dashboard conditions supporting the bearish side.
At this stage, the overall bearish direction was still intact. However, price then entered a temporary recovery phase and started showing signs of short-term strength.
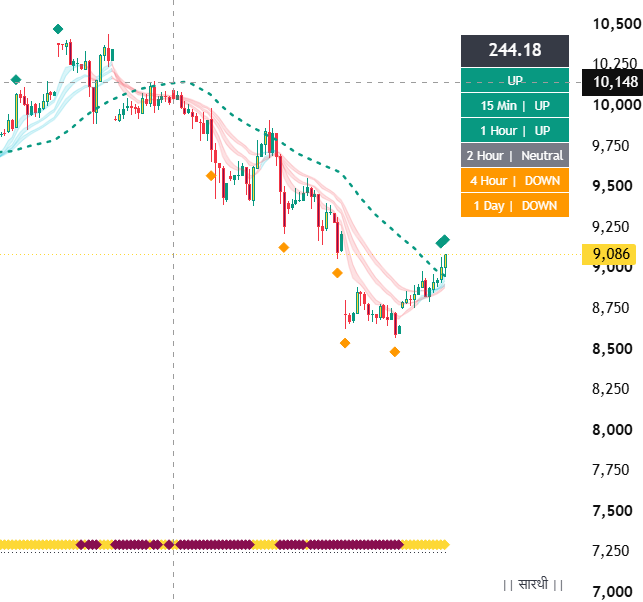
Price Behaviour Begins to Change
In the first chart, price started moving upward from the lower levels and temporarily moved above the SDI.
At the same time:
- The 15-minute and 1 hour timeframe turned UP.
- The 2 Hour timeframes remained Neutral.
- The 4 Hour and 1 Day timeframes continued to show DOWN.
- Momentum showed a temporary bullish indication.
- The EMA Bands shifted toward bullish behaviour.
This created a short-term bullish phase within the already established bearish environment.
The broader higher-timeframe conditions, however, had not changed to bullish.
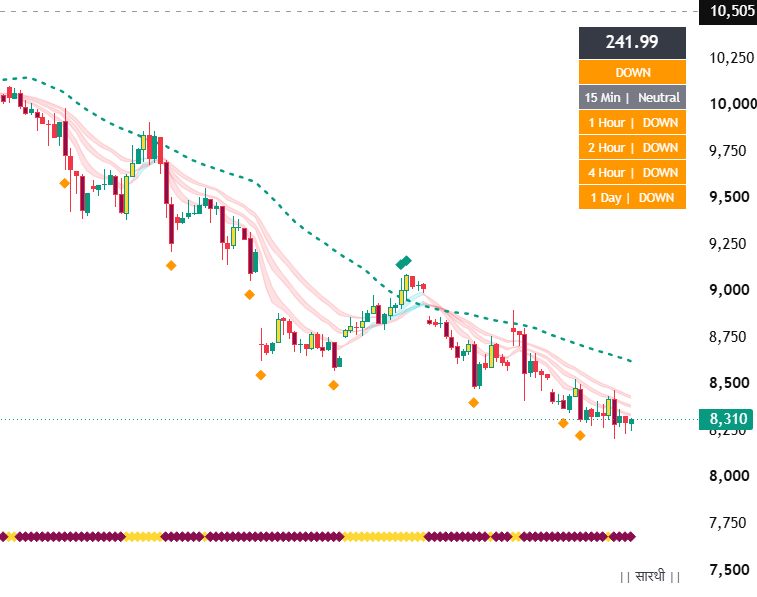
How Did the Move Develop Further?
The second chart shows what happened as this temporary bullish phase developed further.
Price failed to sustain the move above the SDI and started moving back below it.
The Dashboard then became more strongly aligned with the bearish side:
- 1 Hour → DOWN
- 2 Hour → DOWN
- 4 Hour → DOWN
- 1 Day → DOWN
Momentum also shifted back toward the bearish side, while the EMA Bands turned bearish again.
Price then continued moving lower, restoring the previously established bearish structure.
What This Example Shows
This example shows how an established bearish trend can temporarily display short-term bullish behaviour without becoming a complete trend reversal. In the first chart, the framework helped us observe the temporary recovery and the change in short-term behaviour.
In the second chart, the broader conditions realigned with the bearish direction, momentum turned bearish again, and price continued lower. The important observation is that the short-term bullish phase did not develop into a broader directional change. Instead, it became a temporary pause within the existing bearish trend before the original direction resumed.
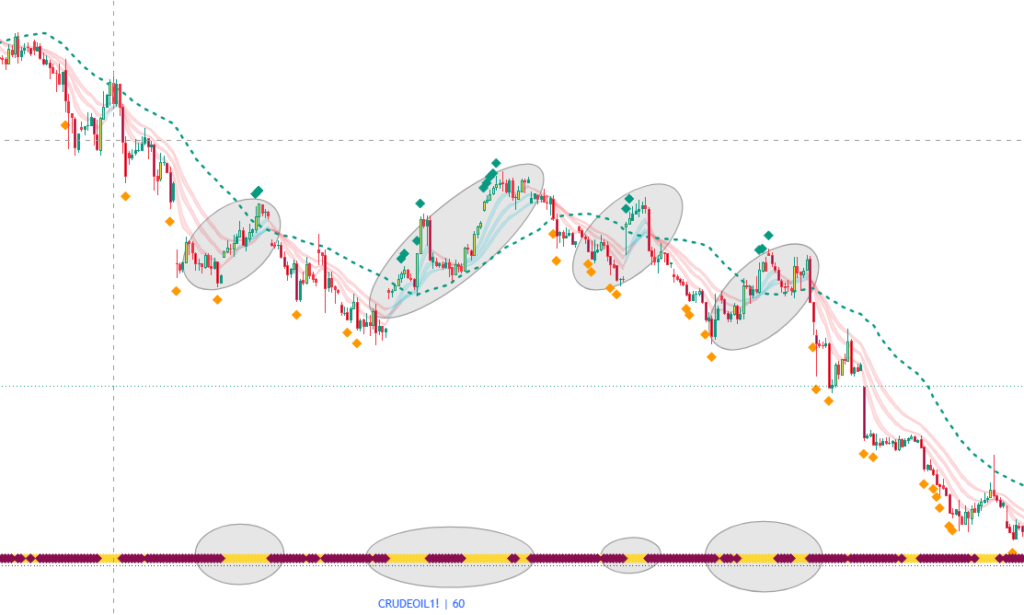
Examples of Trend Continuation
Reversal Situations : Examples
In reversal situations, the market does not simply return to its existing direction after a temporary pause. Instead, the change in price behaviour continues and gradually develops into a new directional move.
Example — Bullish to Bearish Reversal
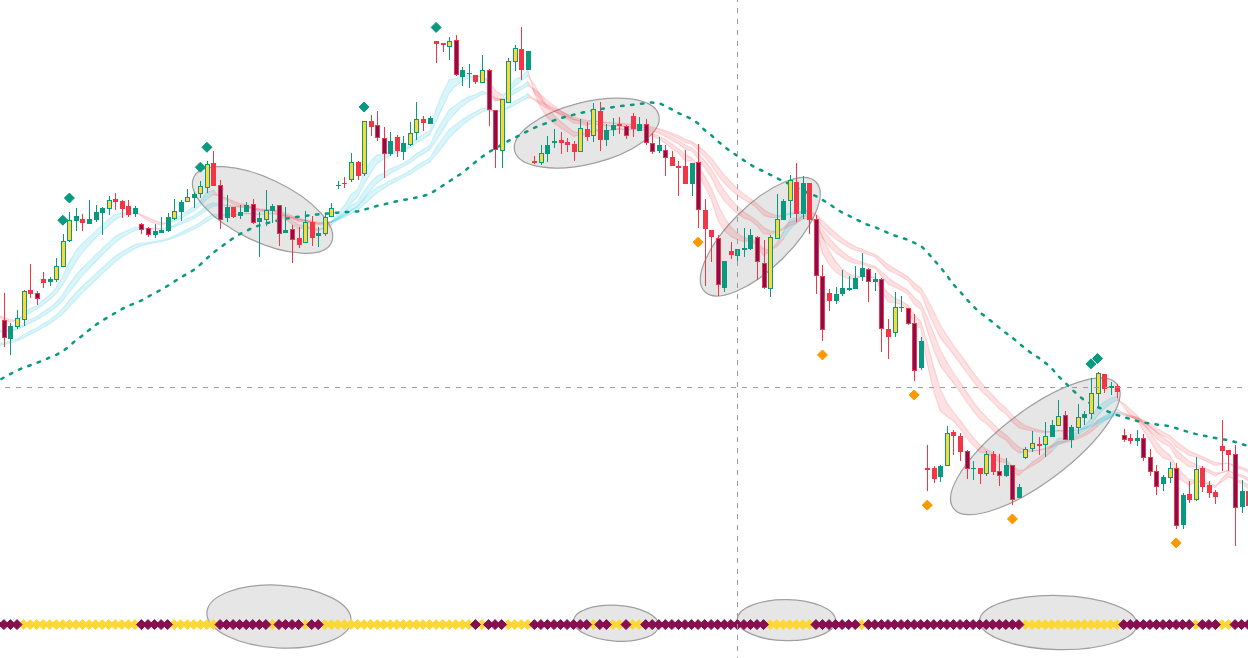
The market had already developed a bullish structure, with price moving upward and the EMA Bands supporting the bullish behaviour.
Price then began to lose strength and entered a period of consolidation. The bullish movement gradually weakened, followed by a shift in price behaviour toward the bearish side.
As the move developed, the EMA Bands turned bearish, bearish momentum indications appeared, and price started developing a lower structure.
The initial weakness therefore did not remain a temporary correction. It continued to develop into a bearish reversal, with the market eventually moving in the opposite direction.
Example — Bearish to Bullish Reversal
The second example shows the opposite situation.
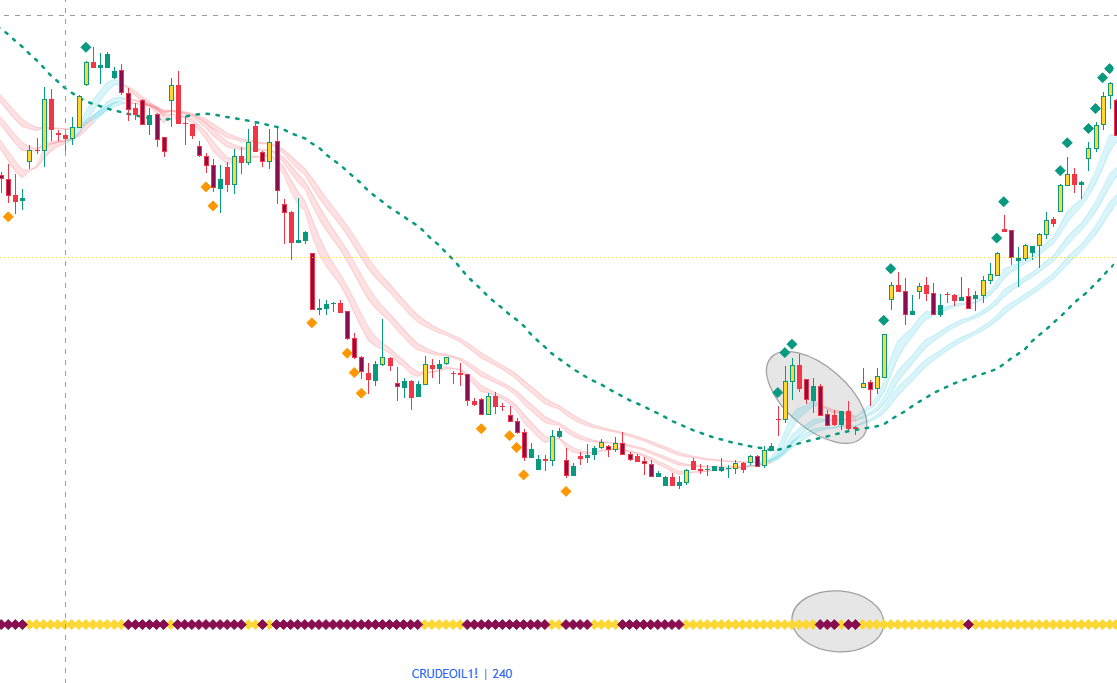
The market had already established a bearish structure, with price moving lower and
the EMA Bands supporting the bearish direction.
Price then began to lose its downward strength and entered a period of consolidation and recovery. Instead of continuing the existing bearish move, price started developing stronger bullish behaviour.
The EMA Bands shifted toward bullish behaviour, bullish momentum indications appeared, a
nd price gradually developed a higher structure.
The recovery therefore developed beyond a temporary correction and
eventually became a bullish reversal.
What These Examples Show
These two examples show both sides of a reversal:
Bullish → Bearish
The existing bullish move loses strength and develops into a bearish direction.
Bearish → Bullish
The existing bearish move loses strength and develops into a bullish direction.
In both cases, the reversal becomes clearer through the continued change in price behaviour, rather than from a single indication alone.
Final Thoughts
Throughout these three parts, I have tried to explain the SMSI in the simplest and most practical way possible. The intention was never to make the market look simple, but to make some of its difficult and technical aspects easier to observe, understand, and apply.
This framework has been developed through years of personal trading experience, observation, and learning from different market situations. Initially, I developed it primarily for myself to deal with some of the challenges I faced while trying to understand changing market behaviour, direction, momentum, and transitions.
Over time, I realized that some of these challenges may not be unique to me. Other traders may also face similar difficulties while trying to understand what is happening between a strong directional move, a correction, a pause, or a possible reversal.
That is what eventually led me to convert this framework into an indicator and make it available to other traders through Saarathi Momentum Shift Indication (SMSI).
SMSI is being published as a proprietary framework because it represents years of personal work, observation, and development. At the same time, sharing it allows traders who find that this approach fits their thinking and methodology to potentially benefit from the same framework.
The framework may not suit every trader, and it does not need to. Every trader develops their own way of understanding and reading the market. The important thing is to find an approach that makes sense to you, understand it properly, and develop your own experience through practice.
We will continue to share updates, observations, and developments related to SMSI through our social media platforms, so traders interested in the framework can continue to follow its journey.
Thank You
Thank you for taking the time to read through all three parts and explore the ideas behind
Saarathi Momentum Shift Indication.
The market will always remain challenging, and no framework can remove that challenge. But with observation, patience, practice, discipline, and continuous learning, every trader can work toward becoming better at understanding their own decisions and the market around them.
Wishing you clarity in your analysis, discipline in your decisions, and consistency in your journey.
Trade with awareness. Learn from every market. Keep improving. All the very best for your trading journey and future.
— Team Saarathi Analytics