Saarathi Momentum Shift Indicator (SMSI) is a visual framework designed to help traders, investors, and market participants better understand trend direction, momentum, and changes in price behaviour throughout their market journey.
In this guide, we explain the indicator component by component using practical examples, real chart screenshots, and simple use cases, so you can understand how each part works and how the complete framework can support your market analysis and decision-making process.
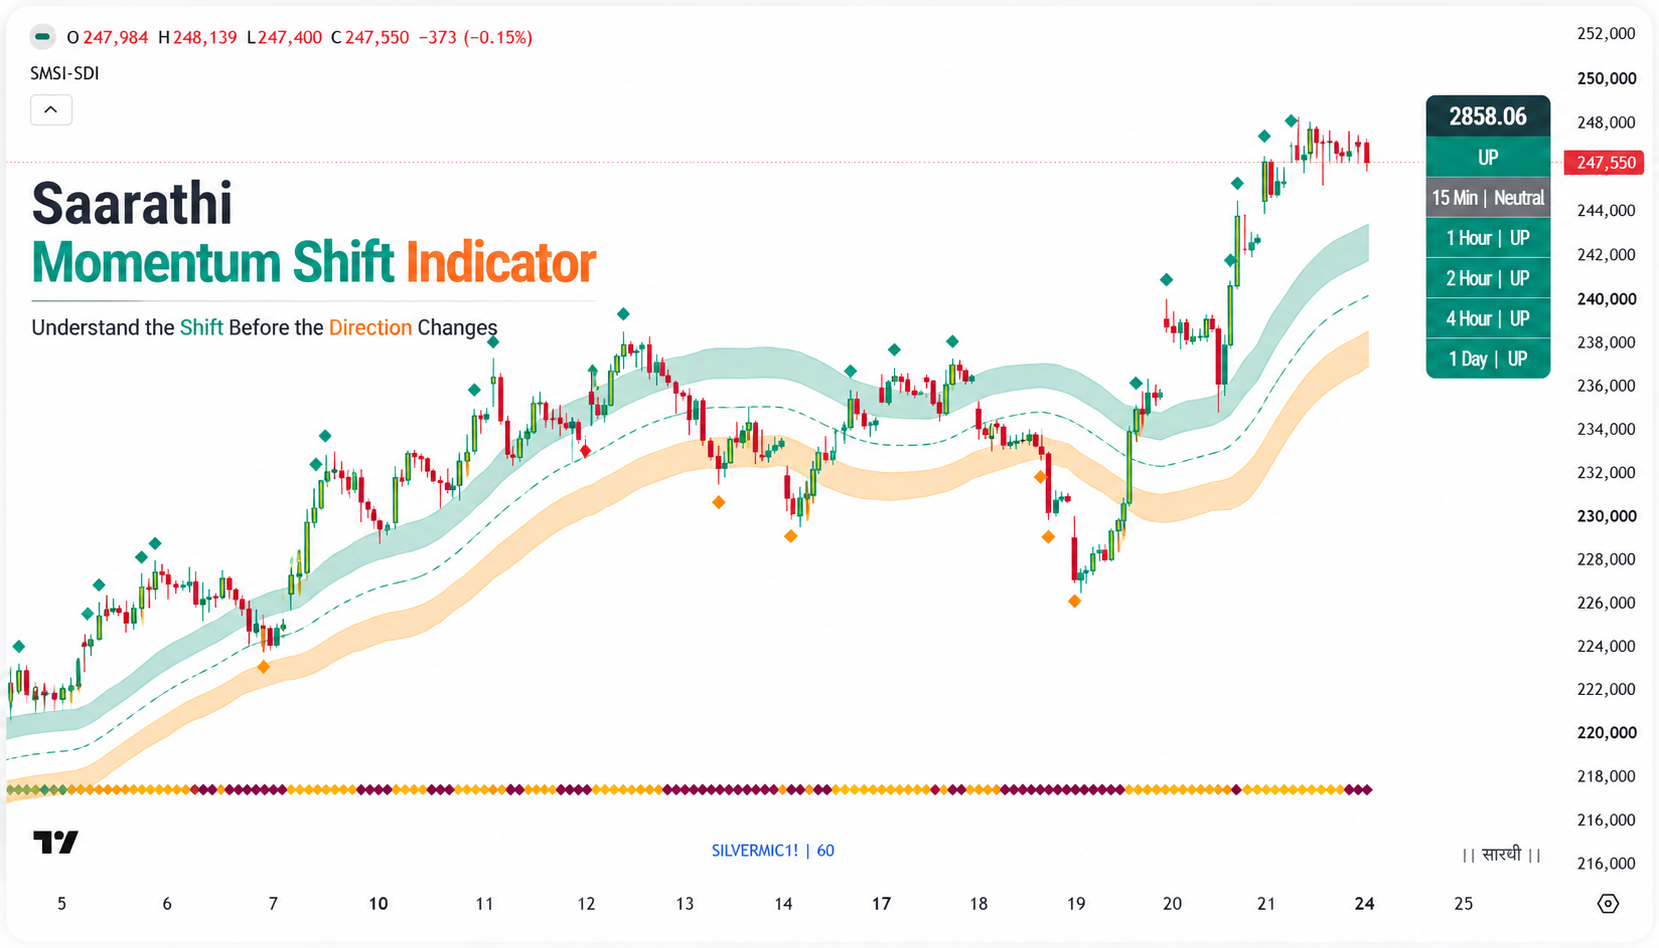
Understand the Shift Before the Direction Changes
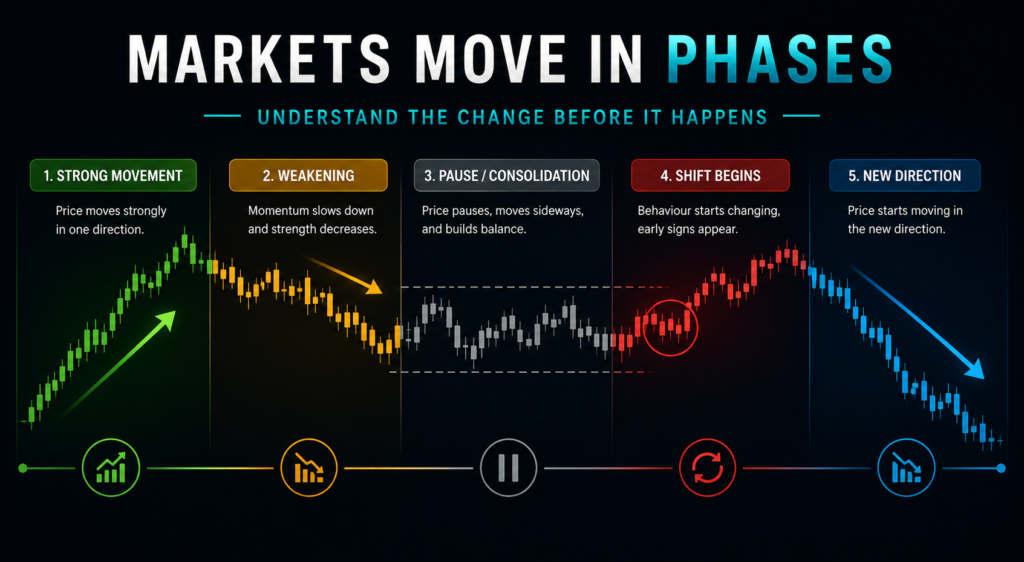
Markets move in phases.
Sometimes price moves strongly in one direction. Sometimes that movement slows down, loses strength, pauses, and eventually starts moving in another direction.
The challenge for a trader is not simply identifying whether the market is moving up or down. The real challenge is recognizing when the behaviour of price is beginning to change.
Saarathi Momentum Shift Indicator (SMSI) is designed around this simple market behaviour concept. It provides a clean visual framework to observe direction, momentum, trigger points, price behaviour, dynamic levels, and multi-timeframe conditions without requiring traders to fill their charts with multiple indicators.
The Logic Behind SMSI
Think About Changing Gears in a Vehicle

Consider a vehicle moving forward. If the driver wants to change its direction and move in reverse, the vehicle does not simply jump from forward to reverse. The vehicle first begins to slow down, its forward movement gradually reduces, and eventually it comes to a stop or Neutral state. Only after passing through this transition can the driver shift into reverse and begin moving in the opposite direction.
In other words, the change from forward to reverse is not an instant switch—it is a process of slowing down, stopping, transitioning, and then moving in a new direction. This simple behaviour provides a useful way to understand how a change in direction can occur.
Now Apply the Same Logic to Price Behaviour
The same logic can be observed in price behaviour.
Before price changes its broader direction, it may first begin to slow down, lose strength, pause, or enter a temporary neutral phase. A bullish move may lose its strength before turning bearish, while a bearish move may weaken before turning bullish.
However, reaching this neutral phase does not mean that a reversal will definitely happen. Price may regain strength and continue in the same direction, or it may lose further strength and establish a new direction.
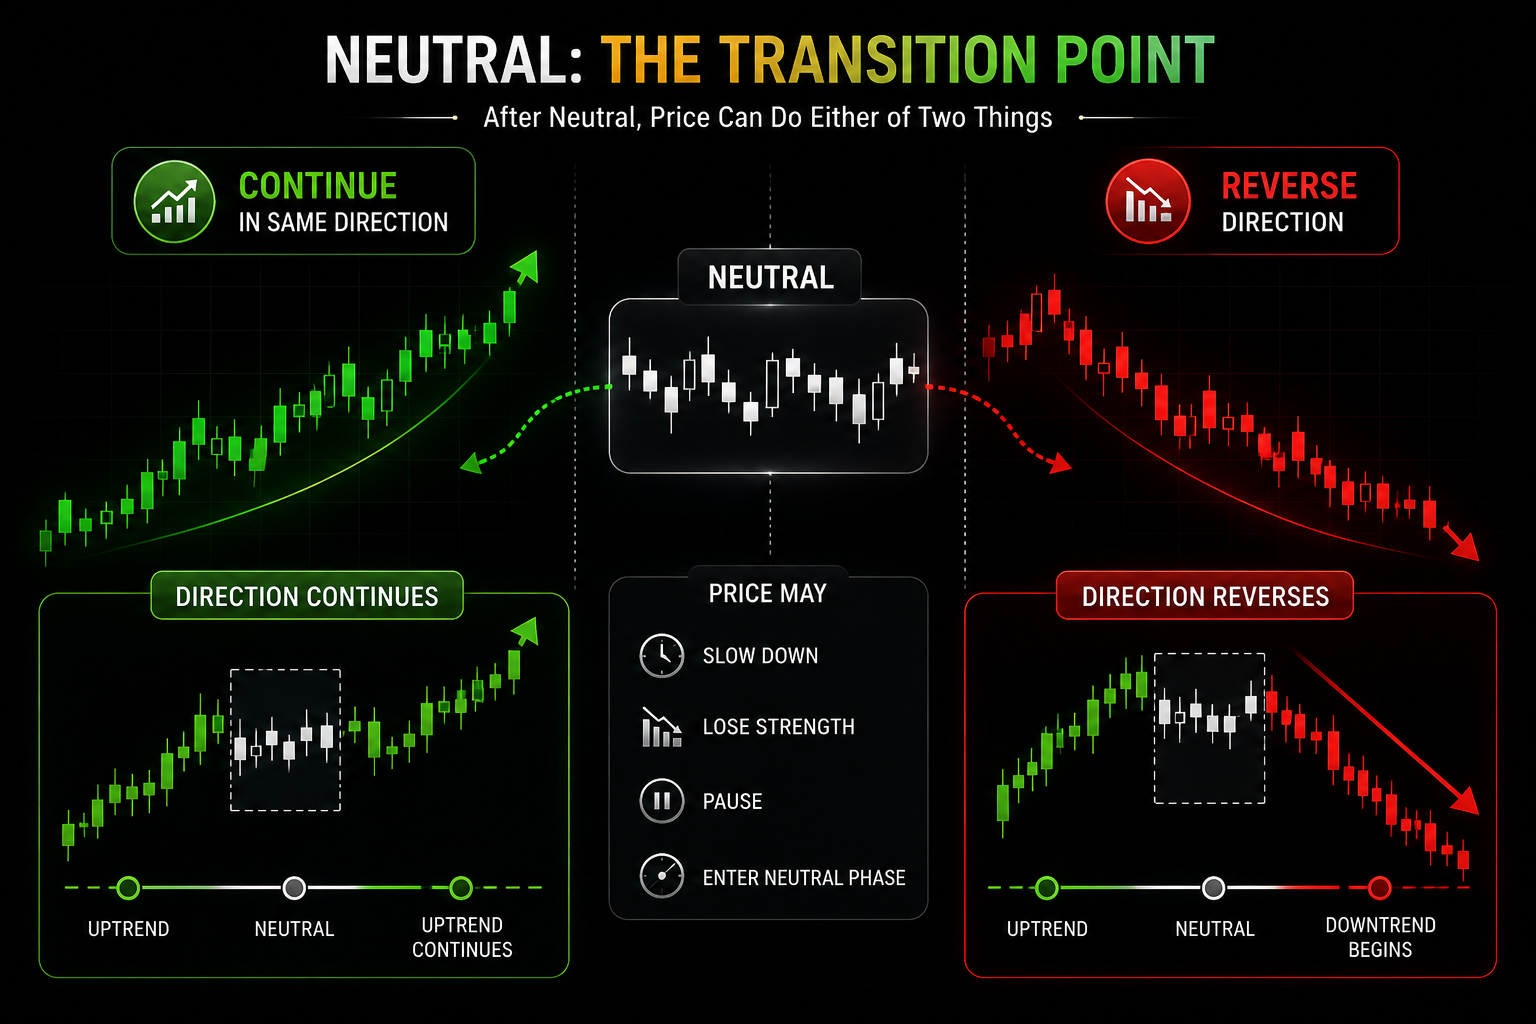
SMSI is designed to help traders visually observe this change in behaviour—before the market fully establishes its next direction.
It does not attempt to predict the future. Instead, it helps traders observe what the market is doing now and make decisions based on the developing price behaviour.
Understanding the SMSI Framework
Saarathi Momentum Shift Indicator is built around eight practical components, each designed to provide a different perspective on market behaviour:
- Trigger Points : Identify where to pay attention and observe potential price reactions.
- Bar Colors : Understand who took control of the previous price range.
- Momentum Shift Indication (SMSI) : Observe changes in price strength before a clear directional shift develops.
- Direction Indication (SDI) : Understand the current directional bias and which side deserves attention.
- EMA Bands : An optional component for additional confirmation, trend tracking, and observing momentum shifts alongside SMSI.
- SDI Bands : Track price strength and use dynamic levels as additional risk-management references.
- Multi-Timeframe Dashboard : See directional conditions across multiple intervals without leaving your current chart.
- Alert Conditions : Predefined alerts for Trigger Points, Momentum Shift Signals, and Possible Trend Continuation to help you stay aware of important market developments.
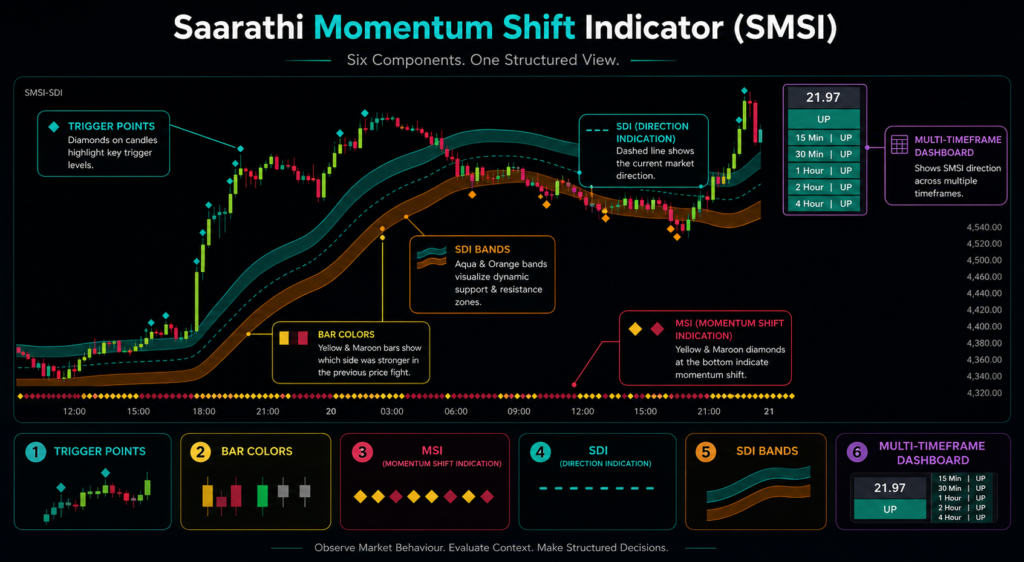
Each component of the Saarathi Momentum Shift Indicator has been designed with a different phase of market behaviour in mind.
A trader needs more than just a direction to understand the market — direction, momentum, timely alerts, price behaviour, and confirmation all play an important role in building a trading decision. These components work together as one structured framework, bringing different aspects of market behaviour into a single visual view and helping traders approach the market in a more organized, objective, and disciplined way.
1. Trigger Points
Your First Alert
Trigger Points are designed to act as your first alert when an important shift in price behaviour may be developing.
A Trigger Point can also be understood as a Breaker Point—an area where price has moved through an important previous market area after overcoming the participation that was present there. In simple terms, the market has pushed through a meaningful swing area and established a new move, making that previous area important for further observation.
The Trigger Point itself is not a Buy or Sell signal. Its primary purpose is to move you from observation mode into action mode—telling you that something important may have developed and that the surrounding price structure now deserves closer attention.
How to Use Trigger Points
Step 1 — Activate Your Observation
When a Trigger Point appears, don’t immediately enter a trade. Instead, move into action mode and start studying the price structure around the trigger.
Step 2 — Mark the Breaker Line
After the Trigger Point develops, identify which previous swing was broken to create the trigger.
Mark the High or Low of that broken swing as your: Breaker Line.
This level represents the area that price had to overcome to establish the new move.
Step 3 — Mark the Territory Line
Next, identify the origin of the move that activated the Trigger Point. The Territory Line represents the area from where that move began — the potential territory of the buyers or sellers that drove price toward the Trigger Point.
For a Bullish Trigger:
Identify the swing that produced the bullish move and locate the candle with the lowest Low within that swing. Mark the High of that candle as the Territory Line. This level represents the area from which buyers took control and pushed price higher.
For a Bearish Trigger:
Identify the swing that produced the bearish move and locate the candle with the highest High within that swing. Mark the Low of that candle as the Territory Line. This level represents the area from which sellers took control and pushed price lower.
The purpose of the Territory Line is to keep the origin of the triggering move visible. If price returns to this area later, its reaction can help us understand whether the buyers or sellers who created the original move are still able to defend their territory.
Simple Rule :
Bullish Trigger → Lowest Low candle → Mark its High as Territory Line
Bearish Trigger → Highest High candle → Mark its Low as Territory Line
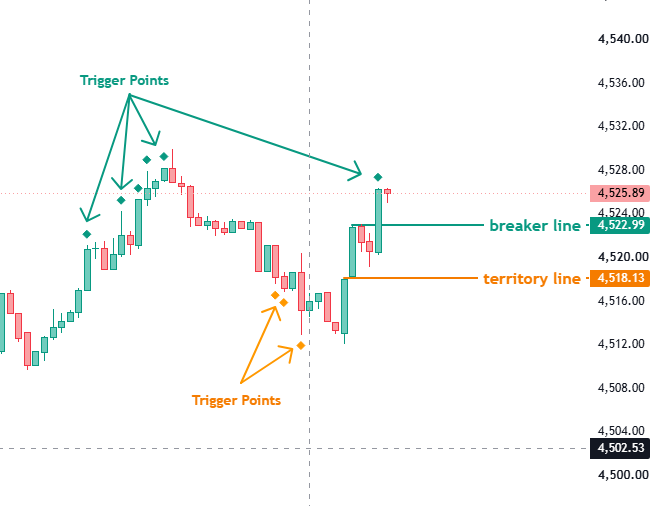
Territory Line represents the territory from where the triggering move originated.
Breaker Line represents the level of the previous swing that was broken to create the Trigger Point.
Step 4 — Observe How Price Reacts
Now the most important part begins.
Do not trade simply because a Trigger Point appears.
Once the Trigger Point develops, observe how price behaves around the Breaker Line and Territory Line.
Continuation Scenario : If price respects the Breaker Line and Territory Line and continues to move in the direction of the Trigger Point, it indicates that the newly established direction is still being respected. This behaviour can provide context for evaluating a continuation setup.
Reversal Scenario : If price fails to respect the Breaker Line and Territory Line, breaks through these important areas, and then develops convincing price-action behaviour in the opposite direction, it may indicate that the previously established direction is losing control and a reversal setup may be developing.
However, breaking a line alone does not automatically mean that a reversal will happen. The reaction of price and the behaviour that follows the break are what matter.
A Simple Way to Remember It
Trigger Point
→ Something important happened. Pay attention.
Breaker Line
→ Where was the previous structure broken?
Territory Line
→ Where did the triggering move originate?
Price Reaction
→ Are these important areas being respected?
Respect → Continuation
Break + Opposite Price Behaviour → Potential Reversal
Important
A Trigger Point is an alert to investigate—not an automatic entry signal.
The Trigger Point, Breaker Line, and Territory Line should be used as contextual references alongside your own price-action analysis, confirmation, and risk-management approach.
2. Bar Colors
Read the Previous Price Battle
Bar Colors are completely optional. You can keep them enabled when you want additional visual information or turn them off when you prefer a cleaner chart.
The concept is simple: the current bar can give you a quick visual clue about who won the price battle in the previous bar.
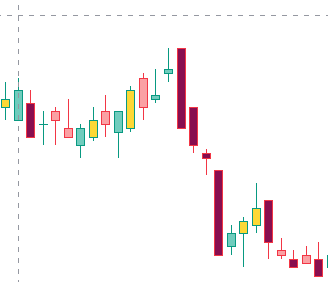
Yellow - Takeover Bar
When price moves above the previous bar’s High and closes strongly, the current bar is highlighted in Yellow.
It indicates that buyers have taken control above the previous bar’s range.
Maroon - Takedown Bar
When price moves below the previous bar’s Low and closes weakly, the current bar is highlighted in Maroon. It indicates that sellers have taken control below the previous bar’s range.
Use this information as supporting context while evaluating a setup around a key level, Trigger Point, or other important price area.
Simple Rule : Yellow → Buyers took control and Maroon → Sellers took control
Bar Colors are supporting information, not standalone Buy or Sell signals.
3. Momentum Shift Indication - SMSI
Observe Momentum Before the Direction Changes
The yellow and maroon diamonds appearing near the bottom of the chart represent the Momentum Shift Indication.
SMSI is designed to help you observe changes in the strength and behaviour of the current price movement. As a trend develops, the indication can continue to reflect the prevailing momentum. When the strength of that movement begins to change, the indication can shift, giving you an early visual clue that the market may be moving toward a different phase.
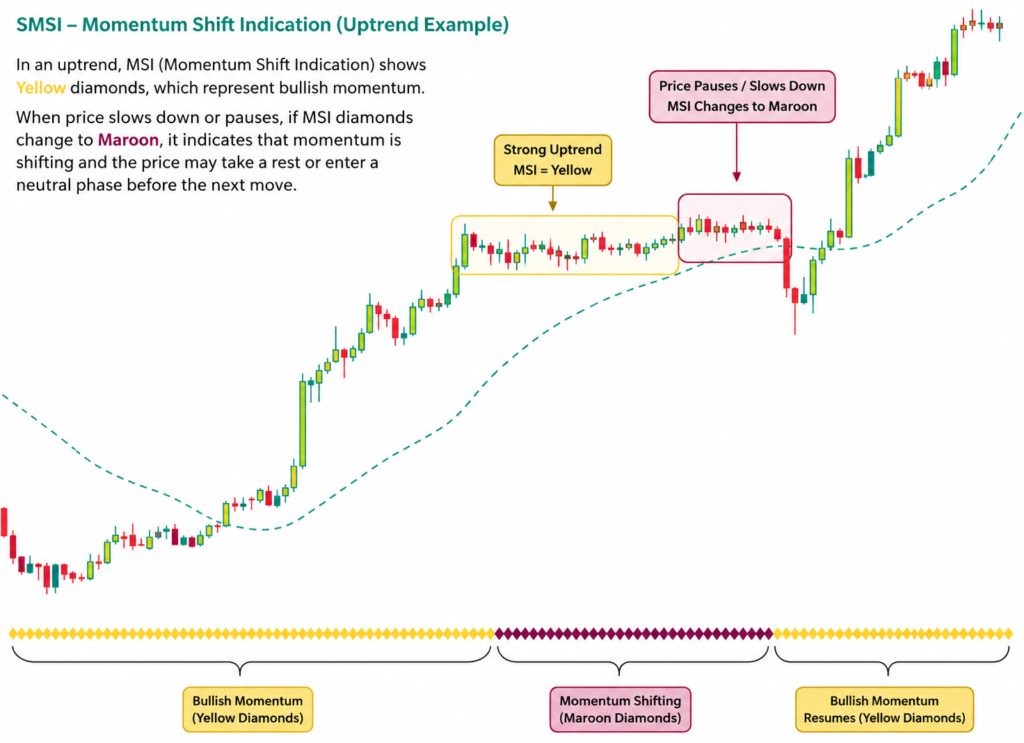
Bullish Momentum → Yellow Diamond
When price is moving upward, Yellow Diamonds represent bullish momentum. If Maroon Diamonds begin to appear, it indicates that the current bullish momentum may be shifting.
This does not automatically mean a reversal. Price may slow down, pause, or enter a temporary neutral phase before either continuing upward or eventually changing direction.
If you are already holding a Buy position, this shift is an early reason to become more observant. You can reassess the trade, monitor the developing price behaviour, and consider holding, managing, or booking partial/full profit according to your trading plan.
For a new trade, the shift can be a reason to wait and observe what direction develops next rather than entering blindly.
Bearish Momentum → Maroon Diamond
When price is moving downward, Maroon Diamonds represent bearish momentum. If Yellow Diamonds begin to appear, it indicates that the current bearish momentum may be shifting.
Again, this does not guarantee a reversal. Price may slow down, pause, or enter a temporary neutral phase before continuing downward or eventually changing direction.
If you are already holding a Sell position, this shift can be an early reason to reassess the trade, monitor price behaviour, and consider profit booking or tighter trade management according to your plan.
For a new trade, wait for the transition to develop and observe which direction establishes itself before evaluating a fresh setup.
The Final Takeaway
Momentum Shift is about awareness, not prediction. SMSI is designed to help you recognize when the strength of the current trend begins to change and when price may be entering a different phase. The important part is not the diamond itself. The important part is what happens after the momentum shift.
The market may : Continue in the same direction or Enter a neutral / sideways phase or Eventually establish a new direction
This makes SMSI useful in two different situations
1. Managing an Existing Trade : Momentum Shift → Reassess the Trade → Manage Risk / Consider Profit Booking
2 . Planning a New Trade : Momentum Shift → Observe the Transition → Wait for Direction → Evaluate the Setup
The objective is not to predict whether the market will continue or reverse. Instead, SMSI helps you become aware that the current behaviour may be changing, giving you an opportunity to observe what the market establishes next.
SMSI helps you notice the shift in momentum before the change in direction becomes obvious.
4. Direction Indication (SDI)
Understand Which Direction Deserves Your Attention
SDI is designed to provide a simple and clear view of the market’s current directional bias.
Its purpose is straightforward : help you understand which side of the market deserves your attention before you start evaluating a trade.
Price Above SDI → Bullish Direction
When price is closing above the SDI, the market is considered to have a bullish directional bias.
This means the bullish side deserves more attention while evaluating potential setups.
Price Below SDI → Bearish Direction
When price is closing below the SDI, the market is considered to have a bearish directional bias.
In this situation, the bearish side deserves more attention while evaluating potential setups.
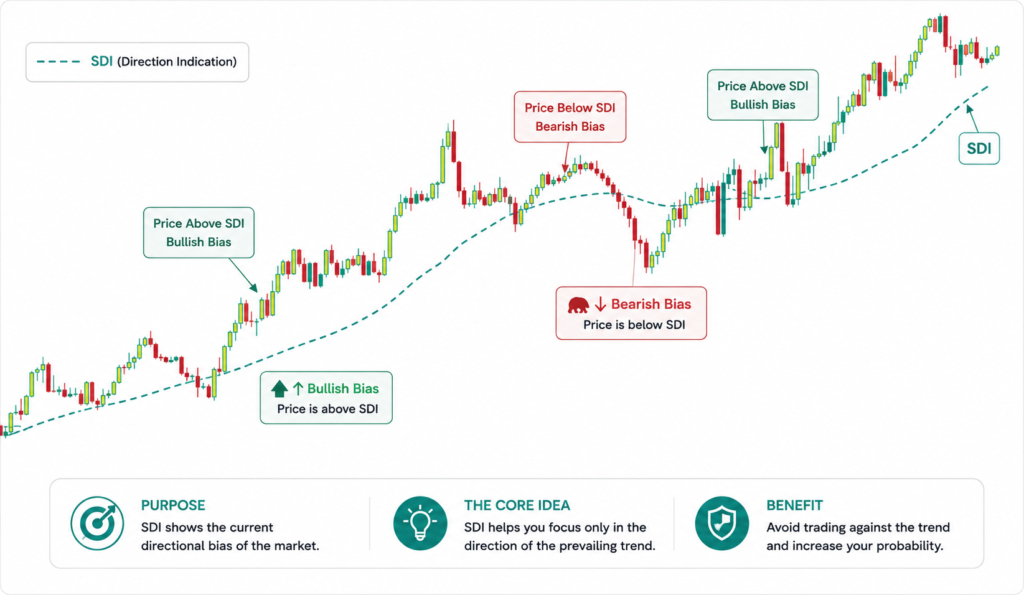
The Simple Rule
Price Above SDI → Focus on Buy-side opportunities
Price Below SDI → Focus on Sell-side opportunities
The purpose of this simple filter is to help avoid one of the most common trading mistakes: trying to trade against the prevailing directional environment without sufficient reason.
SDI is therefore not designed to find the exact entry point.
Its primary purpose is to help answer one simple question : “Which side should I be looking at?”
5. EMA Bands
A Simple Visual Guide to Price Behaviour
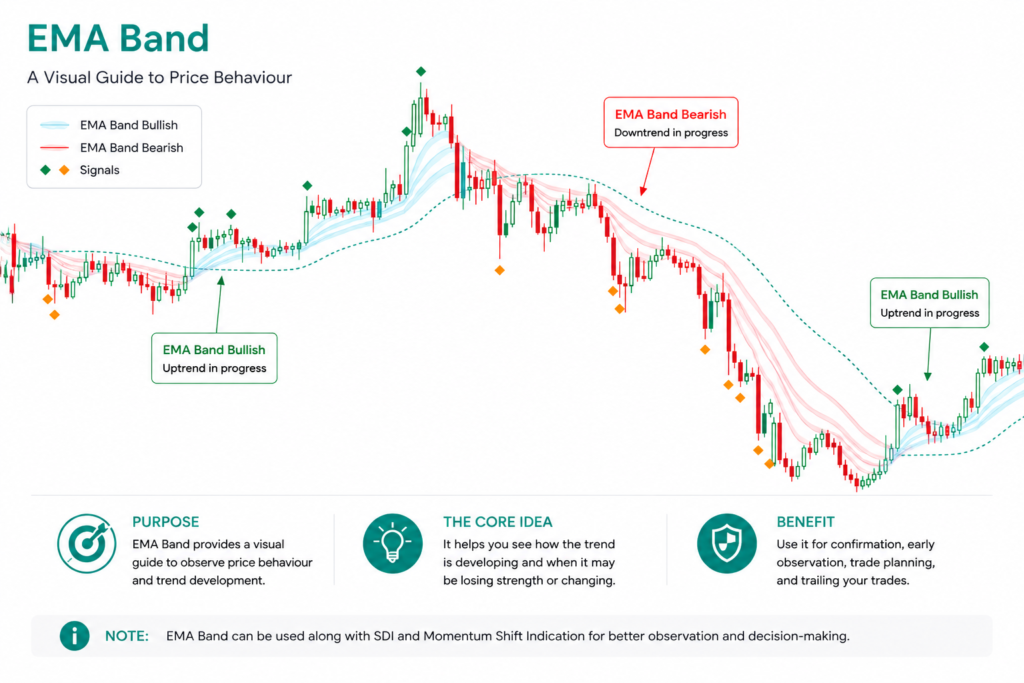
EMA Bands are an additional component of SMSI that provide a clear visual reference for observing price behaviour and trend movement.
Its purpose is simple: to make changes in price behaviour easier to observe visually while working alongside the broader directional information provided by the SDI.
SDI → Shows the broader directional environment
EMA Bands → Helps observe the developing trend and price behaviour
For example, if price is above the SDI and the broader direction remains bullish, but the EMA Bands begin turning bearish, it may indicate that the current movement is losing strength or beginning to change.
This does not automatically mean that the major trend has reversed. It simply becomes an additional point of observation. The same concept can be applied in reverse when price is below the SDI and the EMA Bands begin turning bullish.
Using EMA Bands with SDI and Momentum
EMA Bands can be particularly useful when observed together with the SDI and Momentum Shift Indication.
For example:
Price Above SDI + EMA Bands Bullish + SMSI Yellow
→ The broader direction, trend behaviour, and momentum are supporting the bullish side.
Price Above SDI + EMA Bands Bearish
→ The broader direction may still be bullish, but the current trend behaviour may be weakening or transitioning. This can become an observation point before making a decision.
The same logic can be applied to bearish conditions.
This follows the same idea used throughout SMSI: a change in behaviour can appear before a complete change in direction.
How EMA Bands Can Be Used
EMA Bands can be used in different ways depending on the trader’s methodology.
They can serve as:
- An additional confirmation
- A visual guide for trend direction
- An observation point for possible trend changes
- A reference for trailing an existing trade
- A primary component for planning a trade
A trader may choose to build a setup primarily around the EMA Bands, while using the SDI, Momentum Shift Indication, Dashboard, Trigger Points, and other SMSI components as supporting confirmation.
In this way, EMA Bands do not have to remain only a secondary reference. It can become the main reference of a trader’s setup, while the other components provide additional context and confirmation.
For an existing position, the EMA Bands can also help the trader observe whether the developing trend is continuing or beginning to weaken, which can support decisions around holding, trailing, or reassessing the position.
The exact way it is used remains dependent on the trader’s own methodology and trading style.
The Simple Idea
SDI → Shows the broader directional picture
EMA Bands → Help observe trend and price behaviour
SMSI → Help observe changes in momentum
The EMA Bands can therefore be used either as an additional layer of confirmation or as a primary reference within a trader’s own setup, with the remaining SMSI components helping provide broader context and confirmation.
The objective is not to make one component responsible for every decision. It is to allow the trader to use the components that best fit their own approach and combine them into a structured way of reading the market.
6. SDI Bands
Observe Price Strength & Manage the Move
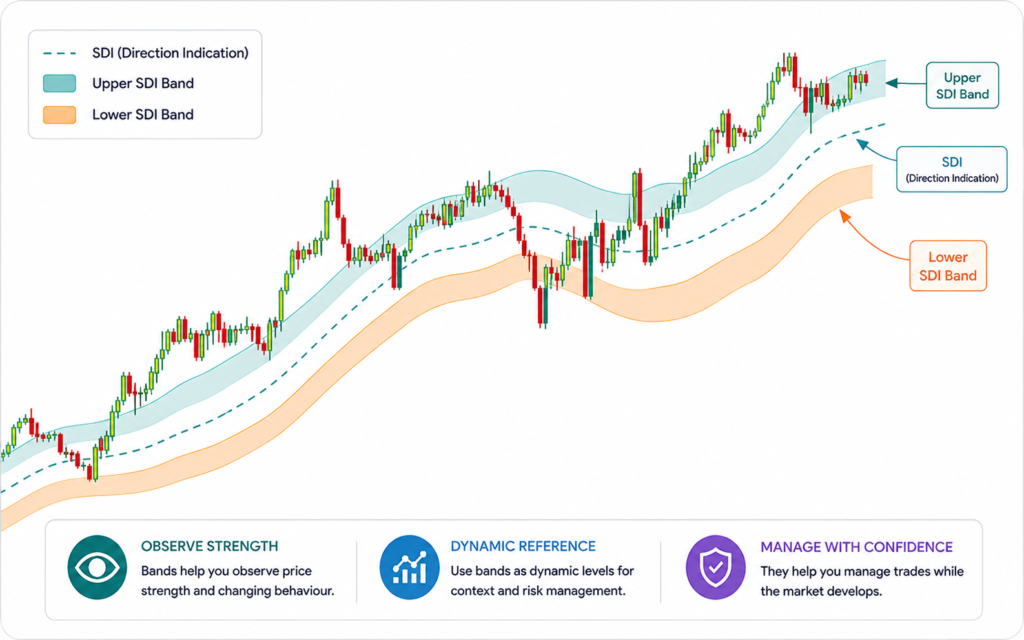
SDI Bands extend the directional view of SDI by adding dynamic levels around it.
These bands can help you observe price strength, changing market behaviour, and potential areas for dynamic trade management. For traders who understand price structure, the bands can provide an additional visual reference to understand whether the current move is continuing with strength or beginning to lose momentum.
When Price Is Above the Band
When price is moving strongly above the relevant band, continue observing the structure of the move.
- Keep marking the new highs as they develop.
- As long as price continues creating new highs, the bullish movement may still be maintaining strength.
- When price stops creating new highs and begins forming a meaningful low, become more alert.
- This may indicate that the current movement is losing strength.
- Price may then enter a sideways phase or begin changing direction.
This does not mean that every lower move is a reversal.
The important point is to recognize when the behaviour of the move is beginning to change.
When Price Is Below the Band
The same concept works in the opposite direction. When price is moving strongly below the relevant band :
- Continue observing and marking new lows.
- As long as price continues creating new lows, bearish movement may remain active.
- When price stops creating new lows and begins forming a meaningful high, become more alert.
- This may indicate that the bearish movement is losing strength.
- Price may then enter a sideways phase or begin changing direction.
For traders who understand market structure, these changes can provide additional context while evaluating whether the current move is still healthy or beginning to weaken.
SDI Bands as a Dynamic Stop-Loss Reference
SDI Bands can also be used as a dynamic reference for managing an existing position.
For a Buy: The lower band can be used as a reference while managing the position.
For a Sell: The upper band can be used as a reference while managing the position.
The idea is to allow your trade-management reference to develop with the market rather than relying only on a fixed stop-loss level. However, the exact stop-loss placement should always depend on your trading strategy, position size, risk tolerance, and market conditions.
SDI Bands help you observe whether price is continuing with strength, beginning to weaken, and where dynamic trade-management levels may be considered.
7. Multi-Timeframe Dashboard
See the Bigger Picture Before You Decide
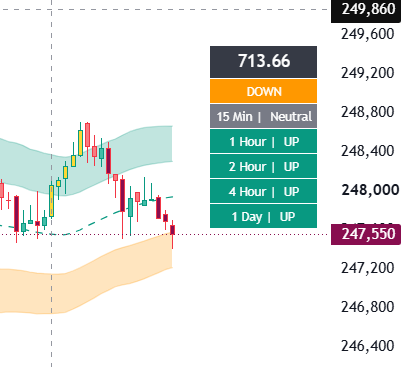
The Multi-Timeframe Dashboard brings the directional conditions of multiple timeframes onto your current chart. You can select up to five different timeframes and observe their directional condition without leaving your current trading timeframe. This is especially useful when trading a smaller timeframe but wanting to understand what the larger market environment is doing.
How to Use the Dashboard
Suppose you are trading on a 5-minute chart and your Dashboard is showing :
15 Min → UP | 30 Min → UP | 1 Hour → UP | 2 Hour → UP | 4 Hour → UP
This tells you that the selected timeframes are currently supporting the bullish side. But the Dashboard is not designed to tell you to immediately buy. Instead, it helps you observe how the different timeframes are behaving and when a transition begins.
Remember the vehicle example: UP → Neutral → UP or UP → Neutral → DOWN
The same transition can be observed across market timeframes.
Smaller Timeframes Can Give Early Information
Suppose the 15-minute, 30-minute and 1-hour timeframes are showing UP while you are trading on the 5-minute chart. If the 15-minute timeframe changes from UP → Neutral, it can become an attention point. It may indicate that the smaller timeframe is beginning to pause or change its behaviour. You don’t necessarily act immediately. You observe what happens next.
Scenario 1 — Neutral → UP
If the 15-minute timeframe moves from UP → Neutral → UP, while your own entry conditions are satisfied, it can provide stronger context for evaluating a bullish opportunity.
The larger timeframes continue to support the direction while the smaller timeframe has completed a temporary transition and is attempting to continue with the broader direction.
Scenario 2 — Neutral → DOWN
If the 15-minute timeframe moves from UP → Neutral → DOWN, the situation changes.
The smaller timeframe may now be developing behaviour against the higher-timeframe direction.
This can be a reason to become more cautious with new long positions and observe whether the larger timeframes also begin transitioning.
The Transition Can Move Across Timeframes
Market behaviour does not necessarily change across all timeframes at the same time.
A smaller timeframe may begin transitioning first:
15 Min → Neutral
↓
30 Min → Neutral
↓
1 Hour → Neutral
This allows you to observe how a developing change in behaviour may progress from smaller timeframes toward larger timeframes. The opposite can also happen. A smaller timeframe may return to the original direction while the larger timeframes remain unchanged. This creates a useful way to observe the market as a sequence of transitions rather than looking at one timeframe in isolation.
Key Takeaway
The Dashboard helps you see where the market is now, which timeframes are supporting the direction, and where a transition may be beginning. It is not about predicting the next move. It is about understanding the relationship between smaller and larger timeframes before making a trading decision.
8. Alert Conditions
Stay Aware of Important Market Developments
Alert Conditions are an additional feature of SMSI designed to help traders stay aware when important conditions develop on the chart, without having to continuously monitor every candle.
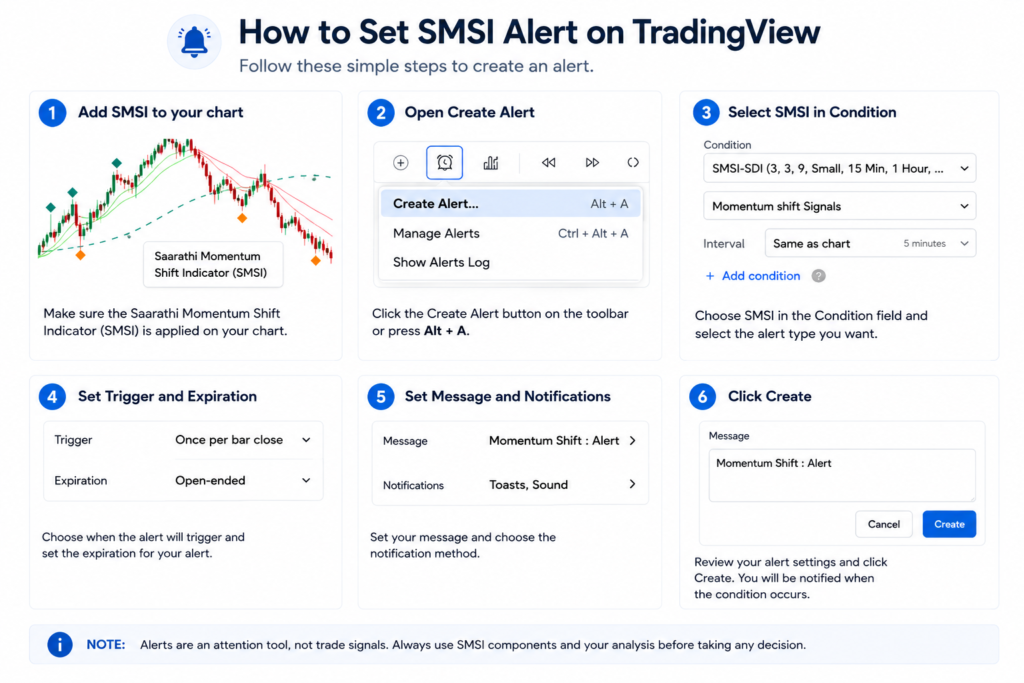
SMSI provides three predefined alerts:
- Trigger Points
- Momentum Shift Signals
- Possible Trend Continuation
These alerts are designed to bring your attention back to the chart. They are not automatic entry or exit signals.
The Three Alert Conditions
Trigger Points → Alerts you when a Trigger Point develops, allowing you to observe the relevant price area.
Momentum Shift Signals → Alerts you when an SMSI momentum-shift condition develops, helping you observe a possible change in momentum.
Possible Trend Continuation → Alerts you when a possible continuation condition develops, allowing you to reassess the developing move.
How to Set an SMSI Alert on TradingView
Step 1 — Open Create Alert : Click Create Alert on the TradingView toolbar or use Alt + A.
Step 2 — Select SMSI : In the Condition field, select SMSI-SDI.
Step 3 — Select the Alert Condition : Choose one of the available conditions: Trigger Points | Momentum Shift Signals | Possible Trend Continuation
Step 4 — Select the Interval : Choose the timeframe on which you want the alert condition to be monitored. You can use Same as chart or select another available interval according to your analysis.
Step 5 — Set Your Preferences : Choose the trigger frequency, expiration, message, and notification method according to your preference.
You can create separate alerts for different conditions if you want to monitor more than one.
For easier monitoring: If you are using a TradingView Premium subscription, you can also use Watchlist Alerts to apply the same alert condition across multiple symbols in your watchlist.
Thank you for taking the time to understand the Saarathi Momentum Shift Indicator (SMSI) and its individual components.
I hope this first part has given you a clearer understanding of how Direction, Momentum, Trigger Points, Bar Colors, EMA Bands, SDI Bands, the Multi-Timeframe Dashboard, and Alert Conditions
each contribute to the overall framework.
But understanding the components is only the first step.
The real value comes from knowing how to read them together and apply them to actual market situations.
So far, we have looked at the individual components of SMSI and understood the role each one can play in reading market behaviour.
But the real value of these components comes from how they work together.
In the next part, we will bring these components into a structured SMSI Trading Framework — moving from direction and broader context to momentum, price behaviour, confirmation, and finally decision-making.
The focus will now shift from understanding the components to understanding how to use them together.