From Components to a Structured Process
In Part 1, we explored the individual components of the Saarathi Momentum Shift Indicator (SMSI) and understood the role each one plays in observing market behaviour.
Now comes the more important question : How do these components work together?
SMSI is not designed around a single signal that tells you when to buy or sell. Instead, its components can be read in sequence to build a more structured view of the market — starting with direction, then observing the broader environment, identifying important developments, watching momentum, evaluating price behaviour, and finally making a decision based on confirmation and risk management. The purpose of this framework is to help the trader move away from reacting to individual indications and instead follow a process.
Part 1 explained the components. Part 2 brings them together into a practical framework.
A Practical Workflow
A simple way to use SMSI is to move through the market in the following sequence :
Direction → Market Environment → Trigger → Momentum → Price Behaviour → Confirmation → Risk Management
Each step answers a different question.
Step 1 — Start With Direction
Question : “What is the current directional environment?”
Start with the SDI on your current trading timeframe.
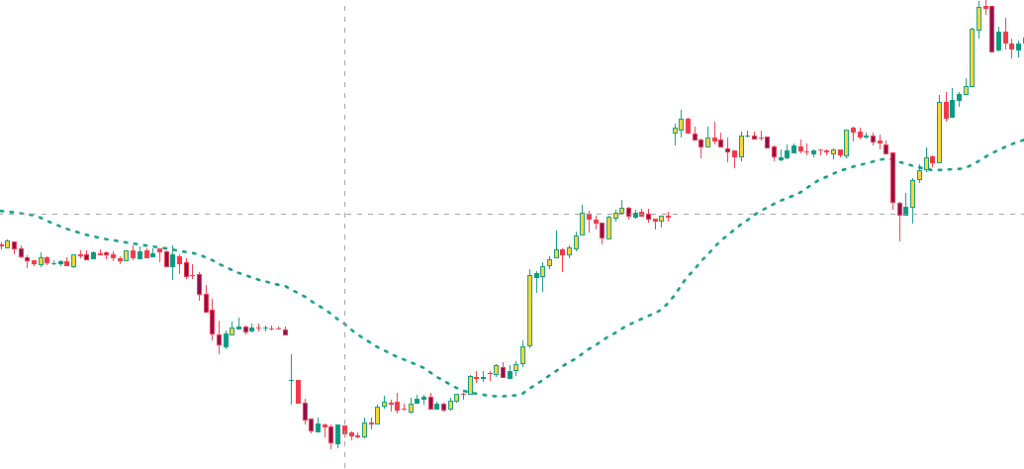
The first objective is simply to understand which direction price is currently supporting.
Price Above SDI → Bullish directional
Price Below SDI → Bearish directional
This gives you the initial directional context for your analysis.
If price is above the SDI, the bullish side becomes your primary area of attention.
If price is below the SDI, the bearish side becomes your primary area of attention.
This does not mean you enter a trade immediately.
It simply establishes the directional side you will focus on while evaluating the rest of the market conditions. Once the current direction is established, the next step is to look beyond the current timeframe and understand the broader market environment.
Step 2 — Check the Broader Market Context
Question: “What are the larger timeframes telling me?”
Now check the Multi-Timeframe Dashboard.
For example, if you are trading on a 5-minute chart and the Dashboard shows :
15M → UP | 30M → UP | 1H → UP
The larger timeframes are also supporting the bullish side.
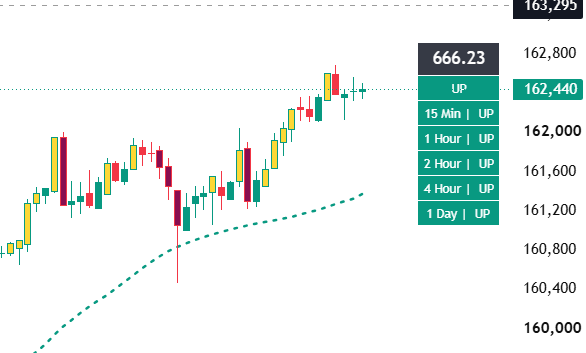
The selected timeframes may be aligned, mixed, or beginning to transition. This gives you additional context before moving to the next step.
SDI → Current Direction
Dashboard → Broader Market Context
The Dashboard helps you understand whether the larger market environment supports or conflicts with your current timeframe.
Step 3 — Watch for Trigger Points
Question : “Has something important happened that deserves closer attention?”
Now watch for a Trigger Point. A Trigger Point is your first alert that an important development may have occurred. It is not an automatic entry signal.
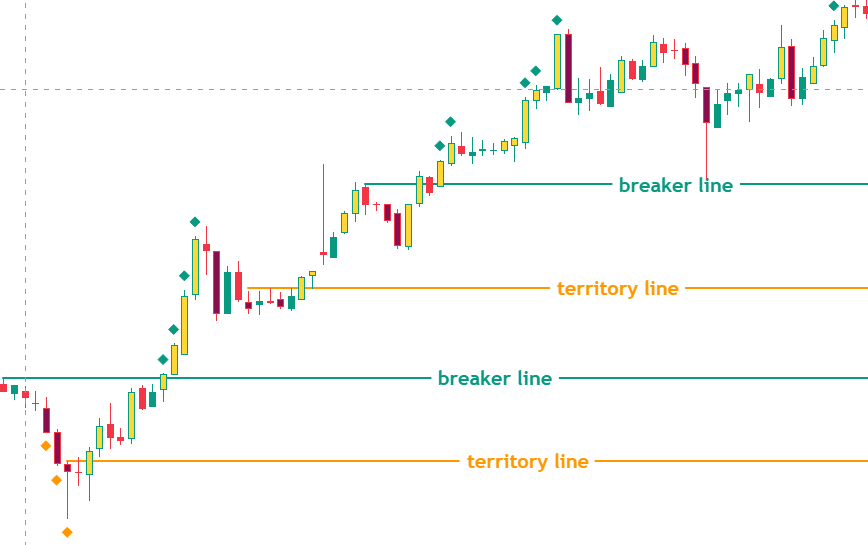
When a Trigger Point appears, move from simply observing the market to actively monitoring the developing area.
Identify the relevant structure behind the Trigger Point and mark the :
Breaker Line and Territory Line
These become important reference areas for observing how price behaves afterward.
The Trigger Point essentially tells you :
“Something important happened here. Start paying attention.”
Step 4 — Check Momentum
Question : “Is the current move maintaining its strength or beginning to change?”
By now, we have established the current direction, marked the Breaker Line and Territory Line after the Trigger Point appeared, and identified the major trend across the selected timeframes using the Dashboard.
Now it is time to check whether momentum is supporting the direction we have identified.
“If the overall setup is bullish, the trader would ideally want the SMSI to show Yellow momentum.”
If SMSI is showing Maroon, momentum is not supporting the bullish direction. In that situation, it is better to wait and observe rather than force a trade.
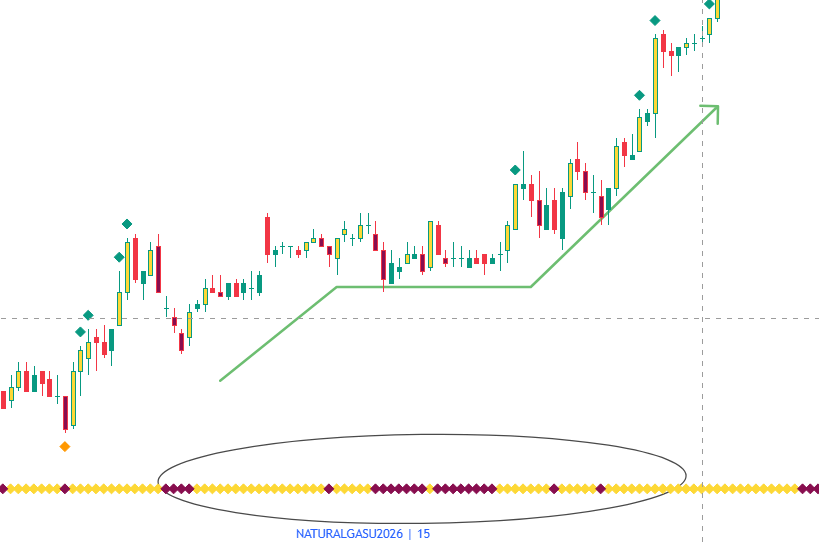
The same logic applies to the bearish side :
Bearish Direction + Major Trend Down + Maroon SMSI → Momentum supports the direction.
Bearish Direction + Yellow SMSI → Momentum is not supporting the direction → Wait.
The EMA Bands can also be used here as an additional visual reference.
If the broader direction is bullish and the EMA Bands are also showing bullish behaviour along with Yellow SMSI momentum, the developing move has stronger visual alignment.
If price remains above the SDI but the EMA Bands begin showing bearish behaviour, it can indicate that the shorter-term price behaviour is weakening or transitioning. This does not automatically mean that the broader direction has changed, but it can be a reason to wait and observe.
The same logic applies in reverse for bearish conditions.
Momentum After Entry
The role of SMSI does not stop once a trade is entered.
For example, if you have taken a Buy trade and Maroon Diamonds begin to appear, it indicates that the bullish momentum may be losing strength. At this stage, price may either pause and continue upward or begin developing behaviour toward a reversal.
If momentum returns to Yellow and price continues to respect the bullish structure, the position can continue to be evaluated according to your trading plan.
If price develops a confirmed reversal, the position can be managed or exited according to your plan.
The same approach applies to a Sell trade when Yellow Diamonds begin appearing.
The EMA Bands can provide another visual reference during this phase. If the EMA Bands also begin moving against the position, it can add to the evidence that the current move is losing strength. If the EMA Bands return to the original direction and price continues to respect the structure, the trader can continue evaluating the position according to the trading plan.
Before Entry → Momentum helps validate the direction.
After Entry → Momentum helps you monitor whether the move is still supporting your trade.
Step 5 — Observe Price Behaviour
Question : “How is price reacting around the important areas?”
Now that direction, broader trend, trigger, and momentum have been checked, the next step is to observe how price behaves around the levels we have marked.
Focus on the Breaker Line, Territory Line, SDI, SDI Bands, EMA Bands, and relevant swing areas.
If price respects these areas and continues in the expected direction, the setup remains supportive. The EMA Bands can also help you observe whether the developing trend is continuing or beginning to change as price reacts around these important areas.
If price fails to respect them and begins developing behaviour in the opposite direction, pause and reassess the setup before taking the next decision.
This step is about watching the reaction, not reacting to a simple touch or break.
Respect → Continue observing the setup
Failure → Pause and reassess the setup
Step 6 — Look for Confirmation
Question : “Does the developing setup have enough confirmation?”
At this stage, bring the different pieces of information together.
You can consider : Direction | Higher-Timeframe Context | Trigger Point | Momentum | Price – Behaviour | Market Structure | EMA Bands | Bar Colors
If Bar Colors are enabled, they can provide additional visual information about the recent price battle.
Yellow → Buyers took control
Maroon → Sellers took control
But Bar Colors should remain supporting information, not become the reason for the entire trade. The same principle applies to the other components. No single indication needs to make the decision by itself. The purpose of the framework is to allow multiple pieces of information to build a clearer picture.
EMA Bands can also provide additional visual confirmation. It can be used either alongside the other SMSI components or, depending on the trader’s methodology, as a primary reference with the remaining components providing confirmation and context.
At this point, you can compare what the market is showing with your own:
- Price-action conditions
- Entry rules
- Setup requirements
- Risk-management rules
Only when your own trading conditions are satisfied should you consider moving toward a trade decision.
Step 7 — Make the Decision & Manage Risk
Question: “Does this setup fit my trading plan?”
If the developing market behaviour matches your own trading methodology and the required confirmation is present, you can evaluate whether the setup is actionable.
The framework does not decide the trade for you. The trader makes the decision. Once in a position, the same framework can continue to provide useful context.
The SDI Bands, EMA Bands, market structure, price behaviour, and momentum changes can be used as supporting references while managing the position. Depending on the trader’s methodology, the EMA Bands can also be used as a reference for trailing a position while the broader SDI direction and other SMSI components provide additional context.
Depending on how the market develops, the trader may need to consider :
- Continuing to hold
- Adjusting risk
- Tightening trade management
- Partial profit booking
- Full profit booking
- Exiting the position
The exact action should always depend on your own trading plan, position size, risk tolerance, and market conditions.
The framework provides context. Risk management determines how you respond to that context.
The Workflow in Action
Now let’s bring the entire workflow together with a simple example.
Imagine you are trading on a 5-minute chart.
Step 1 — Direction
Price is closing above the SDI. The current directional environment is therefore bullish.
Your primary attention is now on the bullish side.
Step 2 — Broader Context
You check the Dashboard: 15M → UP | 30M → UP | 1H → UP
The selected higher intervals are also supporting the bullish environment.
You now have : Current Direction → Bullish and Broader Context → Bullish
But you still do not enter. You continue observing.
Step 3 — Trigger
A Bullish Trigger Point develops.
You identify the relevant structure and mark the Breaker Line and Territory Line.
Now you have a specific area to monitor.
Step 4 — Momentum
The SMSI continues to show bullish momentum, and the EMA Bands is also supporting the developing move. The overall price behaviour is still constructive.
Step 5 — Price Reaction
Price approaches the marked area. You observe the reaction.
Price respects the important reference area and begins moving upward again.
The EMA Bands continues to support the developing trend, adding another layer of confirmation to the price reaction. The developing price behaviour is supporting the bullish context.
Step 6 — Confirmation
Your own price-action conditions are satisfied.
Bar Color may also provide supporting information about the recent price battle.
Now the different pieces of information are beginning to align.
Step 7 — Decision
If the setup meets your own trading rules and risk parameters, you may evaluate the bullish trade.
The important part is that the decision was not based on one signal.
It developed through a sequence :
Direction → Context → Trigger → Momentum → Price Behaviour → Confirmation → Decision
When the Market Enters Neutral
Now consider a different development.
Suppose the higher timeframes are still showing : 15M → UP | 30M → UP | 1H → UP
But the 15-minute timeframe moves from UP → Neutral.
This does not automatically mean that the market has reversed. The smaller selected timeframe may simply be entering a temporary transition phase.
So instead of immediately changing your bias, you observe. This is where the vehicle analogy from Part 1 becomes useful : UP → Neutral → UP or UP → Neutral → DOWN
Both outcomes remain possible.
Scenario 1 — Neutral Returns to UP
If the 15-minute timeframe moves : UP → Neutral → UP
while the larger timeframes continue supporting the bullish environment, the smaller timeframe may simply have completed a temporary pause. If price behaviour and your own entry conditions also support the setup, you may evaluate a bullish opportunity.
The important point is that you observed the transition rather than reacting to Neutral as a reversal signal.
Scenario 2 — Neutral Moves Toward DOWN
Now imagine the 15-minute timeframe moves : UP → Neutral → DOWN
The situation has changed. The smaller timeframe is no longer simply resting.
It may be beginning to develop behaviour against the higher-timeframe direction. This does not automatically mean you should enter a short trade. Instead, it becomes a reason to become more cautious and observe whether the change develops further.
For example : 15M → DOWN
followed later by : 30M → Neutral
and eventually : 1H → Neutral
This can provide a way to observe how a developing change in behaviour may be progressing from smaller timeframes toward larger ones.
Using SMSI for an Existing Trade
The framework can also be useful after a trade has already been taken. Imagine you are holding a Buy position during a strong uptrend. Price has been moving upward and the SMSI is showing bullish momentum. Then the momentum indication begins to shift.
This does not mean : “Exit immediately.”
Instead, it tells you : “The behaviour of the current move may be changing. Pay closer attention.”
You can now reassess:
- Is price still making meaningful new highs?
- Is momentum returning?
- Is price entering a neutral phase?
- Are important levels still being respected?
- Is the broader timeframe context still supportive?
- Are the EMA Bands still supporting the developing trend?
Depending on what develops, your trading plan may call for holding, tightening risk, partial profit booking, or exiting the position. The same principle applies to a Sell position when bearish momentum begins to weaken. The EMA Bands can provide an additional visual reference for deciding whether to continue tracking the trend, tighten trade management, or reassess the position.
Using SMSI for a New Trade
SMSI can also be used while planning a new trade. Instead of searching for an entry immediately after seeing one indication, you can allow the framework to develop.
EMA Band can also be used as part of a new trade setup. A trader may choose to use the EMA Bands as the primary reference for the developing trend and use the SDI, Dashboard, Momentum Shift, Trigger Points, and other components as additional confirmation.
For example :
Direction → Bullish
Higher-Timeframe Context → Bullish
Trigger → Appears
Momentum → Shifts / Develops
Price Reaction → Observed
Confirmation → Satisfied
Decision → Evaluate Trade
This process gives the trader a reason to wait for the market to develop instead of reacting to every individual indication.
The goal is not to make the process complicated. It is to make the decision more structured and objective.
Continuation or Reversal?
One of the most important principles behind the SMSI framework is that a transition does not automatically equal a reversal. The EMA Bands can provide another visual clue during this transition, but the direction of the EMA Bands alone should not be treated as proof of continuation or reversal.
A bullish market can develop as :
Bullish → Neutral → Bullish : The market paused, regained strength, and continued.
or
Bullish → Neutral → Bearish : The market lost strength, transitioned, and eventually established the
opposite direction.
The same applies to a bearish market : Bearish → Neutral → Bearish or Bearish → Neutral → Bullish
This is why the framework focuses on what happens after the transition. The transition creates awareness. Price behaviour provides the next piece of information.
Who Should Use SMSI?
SMSI may be suitable for traders who :
- Prefer clean and visual market analysis.
- Want to understand direction before looking for entries.
- Use multiple timeframes as part of their trading process.
- Want to observe changes in momentum and price behaviour.
- Use price action and market structure in their analysis.
- Prefer a confirmation-based approach rather than reacting to every price movement.
- Want an additional visual reference for trend direction, confirmation, or trade management.
The framework can be adapted to different trading styles, including intraday and short-term trading, depending on the trader’s own methodology, experience, and risk-management approach.
The Final Verdict
Throughout this article, we have used a simple vehicle and gear-shifting analogy to help explain how different market phases can develop. The simplicity of this analogy should not be misunderstood as a suggestion that the market itself is simple, or that this framework represents everything involved in trading.
The market involves many other important aspects, including trader psychology, risk management, trade management, market structure, execution, and many other factors. These are important subjects in their own right and can be explored separately. In this article, our focus has specifically been on the SMSI framework and how it helps us observe market behaviour.
The purpose behind the vehicle and gear-shifting analogy is simple: to explain a difficult and technical subject in a way that is easier to understand and remember.
The concepts behind this framework are grounded in fundamental market principles such as demand and supply, accumulation, distribution, momentum, participation, and changing market phases. We have brought these concepts together and organized them into a framework that makes market behaviour easier to observe and understand.
The idea behind SMSI is not to make the market more complicated. It is to take the complexity that already exists and present it through a simple, structured, and visual approach.
This framework was developed around a practical problem : How can a trader understand changing market behaviour, direction, momentum, and transitions more clearly?
We have brought the relevant concepts together into a framework that works for us as a structured way of reading the market. Our hope is that it can also help other traders find a clearer path through the complexity of market behaviour.
The market remains complex. We have simply tried to make its behaviour easier to observe, understand, and follow.
Disclaimer
Saarathi Momentum Shift Indicator (SMSI) is a proprietary analytical and visualisation tool developed by Saarathi Analytics for educational and informational purposes. It is intended to be used as a supporting tool for market observation and analysis, and not as a substitute for independent judgment, trading knowledge, or proper risk management.
SMSI does not constitute financial advice, investment advice, trading advice, a recommendation, solicitation, or an offer to buy or sell any security, derivative, or other financial instrument. The indications and information provided by the framework should be treated as analytical inputs, not as guaranteed instructions for entering or exiting a trade.
No indicator, framework, strategy, or methodology can guarantee a particular trading outcome. SMSI does not guarantee profits, successful entries, accurate reversals, trend continuation, or any particular result. Any indication displayed by the indicator may fail, change, or become invalid as market conditions develop.
A bullish, bearish, neutral, momentum-shift, Trigger Point, Dashboard, SDI, SDI Band, EMA Bands or any other indication should not be interpreted as a certainty about future price movement.
Use SMSI as a Supporting Tool
SMSI is intended to support your decision-making, not make decisions on your behalf.
Every trader is different. Individual psychology, discipline, patience, experience, risk tolerance, personality, and decision-making style can influence how a person approaches trading.
A framework that suits one trader may not necessarily suit another. If the way SMSI presents market information does not match your thinking style, trading methodology, personality, or comfort level, you are not required to use it.
We recommend that users study, practise, test, and become familiar with the framework before relying on it in live trading. Practice should include observing how it behaves across different market conditions, including trending, sideways, volatile, and transitional environments.
You Do Not Need Every Tool
Trading does not require mastering every available concept, indicator, or tool.
A warrior does not need to master every weapon available to win a battle. What matters is knowing the weapons they understand, practising with them, and using them effectively when required.
Trading can be approached in the same way. You do not need to use every indicator, concept, or component available in the market. The important thing is to identify the tools that fit your methodology and thinking, understand them properly, and develop sufficient practice to use them consistently.
The same applies to SMSI. Although the framework contains multiple components, traders do not necessarily need to use every component in every situation. They can determine which elements fit their own process and use them accordingly.
Your Decision, Your Responsibility
The final decision to enter, hold, modify, manage, or exit a position remains entirely with the trader.
Users are responsible for considering their own :
- Financial situation
- Trading experience
- Risk tolerance
- Trading objectives
- Position size
- Risk-management approach
- Trading methodology
Trading and investing in financial markets involves substantial risk, including the possibility of losing part or all of your capital. Futures, options, and other leveraged or derivative instruments can involve significant risk and may not be suitable for every person.
Appropriate risk management, including suitable position sizing and stop-loss planning where applicable, should always be considered.
Any examples, charts, workflows, scenarios, or explanations presented in this article are provided for educational and illustrative purposes only and should not be interpreted as a promise or expectation of similar results in actual trading.
Past market behaviour, historical observations, backtesting, or previous performance should not be considered a guarantee of future results.
Saarathi Analytics and the creators of SMSI do not accept responsibility for any financial loss, trading loss, missed opportunity, profit, or other outcome arising from the use, interpretation of, or reliance upon the indicator or information presented in this article, to the extent permitted by applicable law.
By using or relying upon SMSI, you acknowledge that you are solely responsible for your own trading and investment decisions.
Key Takeaway
The SMSI Trading Framework brings the different components together to help you observe the market as it develops — from direction and context to momentum, price behaviour, confirmation, and trade management.
Thank you for taking the time to explore the Saarathi Momentum Shift Indicator (SMSI) and understand the framework behind it.
In Part 3, we will take it to the charts and walk through practical examples step by step — looking at different market situations, how the indications develop, and how the complete SMSI framework can be used to analyse them.