In this article, we will explain how to use the Saarathi – The Divine Guide Indicator in a simple and practical way. How to adjust its settings properly, and where each component should be used.
Most importantly, this article will show you how to use Saarathi in real market conditions — not just theory, but actual trading application. By the end of this article, you will clearly understand how to use the indicator in a structured and confident way.
Before You Start Using the Indicator
Before using the Saarathi Indicator, let us discuss some important points. First, remember one thing clearly — an indicator is only a tool. It does not guarantee profit. It only gives clarity so that we can take better entry and exit decisions in the right direction. There is no guarantee in trading. Both profit and loss are possible. That is why, before moving forward or using this indicator, we strongly recommend that you carefully read our previous articles and understand the disclaimer properly.
We are here for your benefit, but disciplined learning and risk management are always your responsibility.
now, let’s begin
Two Important Decisions Before Taking Any Trade
Before trading any asset, two important things must be decided:
- Which time frame will you trade on?
- Will you buy or sell? (Direction of the trade)
Without clarity on these two points, moving forward in the market can create confusion. So before we go deeper into the Saarathi Indicator, we must first understand how to select the proper time frame and how to decide the direction.
Time Frame is the Key Element of Trading
Every trader has their own comfort when selecting a time frame and finding direction. Most traders feel confused about time frame selection. They often ask, “Which time frame is the right one?”
The truth is, there is no single perfect time frame. Time frame selection depends on your trading style, your nature, and your personality as a trader.
For example:
Swing Trading → 1 hour, 2 hour, 1 day, 1 week
Intraday Trading → 5 minute, 15 minute, 1 hour
Scalping → 1 minute, 5 minute
If you are patient, you may prefer higher time frames. If you like fast action, lower time frames may suit you better.
The good part is — Saarathi works effectively on all time frames.
So instead of getting confused, we will follow a clear structure based on Saarathi’s framework.
Saarathi Framework (The Two Time Frame Concept)
To use Saarathi properly, we always work with two time frames:
STF (Saarathi Time Frame)
RTF (Rathi Time Frame)
The word Saarathi means a guide — someone who shows the path. The Rathi is the warrior who moves forward in that direction and reaches the destination.
Just like Lord Shri Krishna became the Saarathi and guided Arjun towards victory, this indicator is designed to guide you in the right market direction.
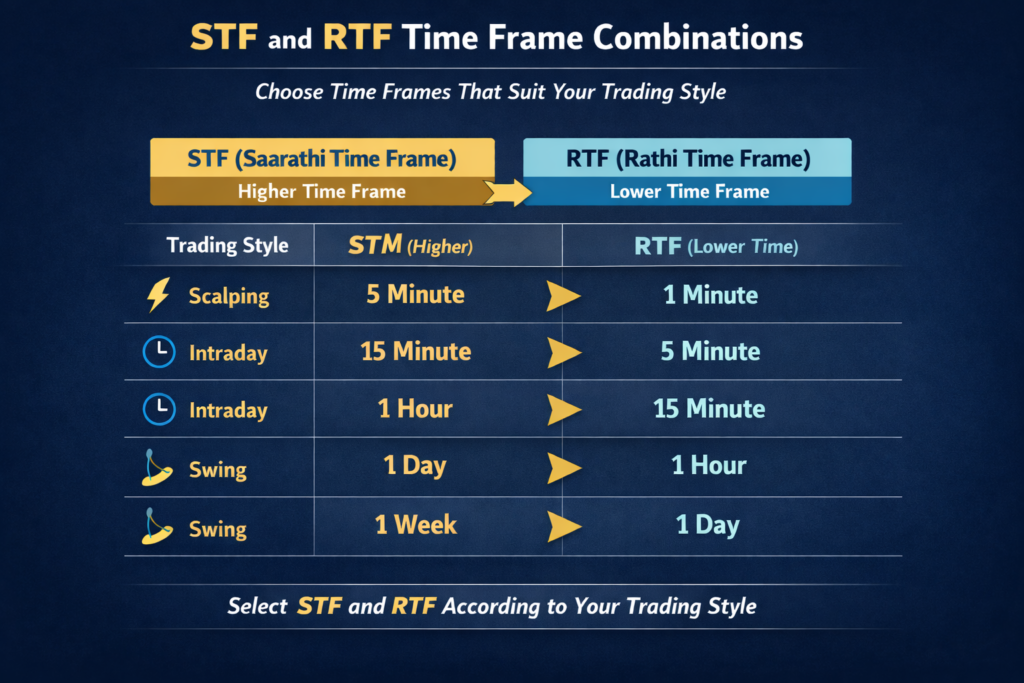
- STF (Saarathi Time Frame) → Used to generate alerts and identify direction.
- RTF (Rathi Time Frame) → Used to execute the trade in that guided direction.
STF will always be higher than RTF. Saarathi Time Frame (STF) shows the path. and Rathi Time Frame (RTF)
takes action.
Direction of the trade
Now we have selected the time frame. The next most important question is: When should we buy and when should we sell? In simple words — how do we find direction and execute the trade?
The market moves every second. But that does not mean we should try to trade everywhere or make decisions at every candle. Instead, we must find specific areas where we can execute trades with confidence.
This is where the POI Bar plays an important role. The POI Bar is one of the main components of the Saarathi Indicator. It helps you identify important areas in the market where price reaction is more meaningful. Along with the POI Bar, we have two additional components that help you understand the market direction more clearly. If you understand price action well, the POI Bar alone can be enough for trading decisions.
However, if you feel confused while finding direction, you can use the other two components for additional confirmation and clarity.
Saarathi (TDG) – Overview
So far, we have discussed time frame selection and the components that help us find direction.
Now it’s time to understand the indicator itself — its overview and its settings. Since we have already explained the components in the previous article, we will not go very deep into their basic details here.
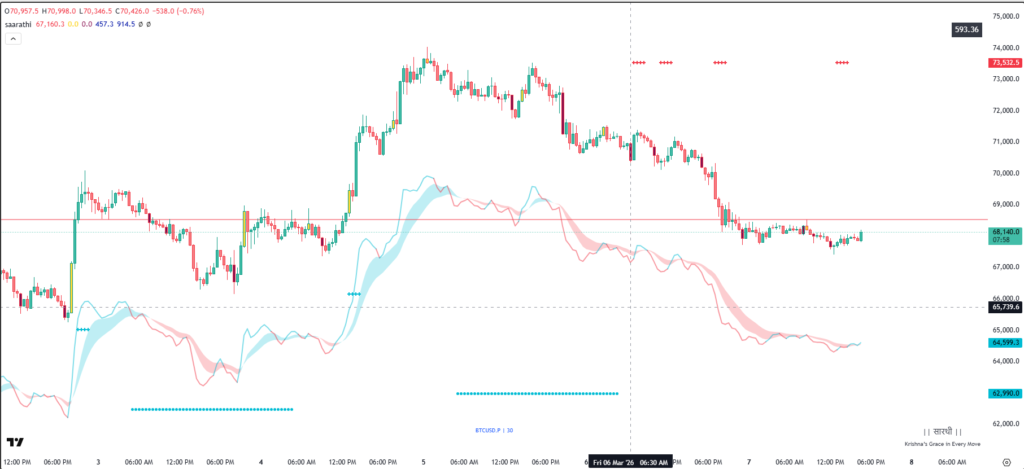
By default, only the POI Bars are visible on the chart. If you want to use additional components, you can go to the settings panel and turn on/off : Direction Line and Direction Band .The Direction Line also has a distance adjustment option, so you can adjust it according to your price scale and chart structure.
The colored line represents the Direction Line. The Direction Line helps identify the overall price direction, structure breakouts and structure shifts.
The circles and crosses plotted on the chart represent STF defence areas, shown in aqua and red colors. An option is provided in the settings to select the STF, allowing you to view higher timeframe levels while remaining on the current timeframe. To use this effectively, it is recommended to mark the recent levels with horizontal lines.
On the top right side, you can see a black box. This box shows the possible movement range based on current market volatility. It gives an idea of how much price can move in the present condition.
At the bottom of the chart, you will see yellow and maroon diamonds. These diamonds represent the POI Bars. They are specially designed so that even when you zoom out, you can easily identify where POIs were formed on the chart.
The aqua horizontal line visible on the chart represents the Defence Line. For a bullish POI, the Defence Line is plotted in aqua color. For a bearish POI, the Defence Line is plotted in red color. If price breaks decisively in the opposite direction, it may indicate that control is shifting and the stronger side has changed.
You can also set alerts in Saarathi. Whenever a POI Bar is formed, you will receive an alert notification. This means you do not need to sit in front of the chart all the time — the system will notify you when a setup appears.
This is the overall structure of the Saarathi Indicator.
Now, in the next section, we will discuss step by step how to use it to make trading decisions.